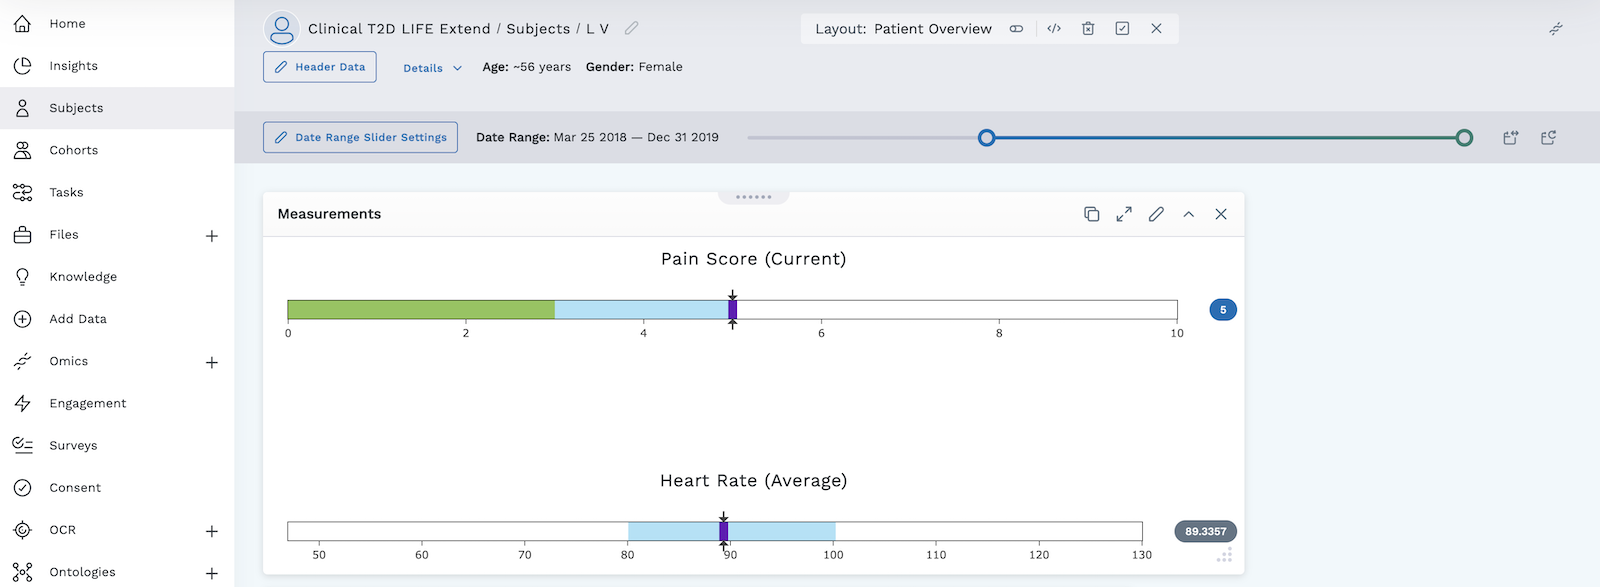
Measurements Module
The measurements module generates a graph in the Subject Viewer layout from data that has been stored as Observations. You can configure it to display measurable data in a number of different ways. More visualization options are available when using the measurements module than with the graph module.
The graph module is similar to the measurements module, but it can display a visualization for a number of different resource types, such as Observations, Medications, Procedures, Physician Encounters, Conditions, and Goal. The measurements module can only display a graph from the Observations resource type.
Add a Measurements Module
- Begin by following the instructions to Add a Module to a Layout.
- From the Build Your Own module page, select the Measurements tile .
- Enter the title of your measurements module in the box under Module Name.
- Until you have added multiple dimensions, you will only be able to select Range Slider under Visualization Type.
- Click on the blue + Add Dimension button.
- Select the plus sign to begin adding details for the first dimension.
- Give your dimension a name.
- Use the drop down menu under Value Sampling to select Average, Minimum, Maximum, First, or Last.
- Select the code for the subject's data you will be measuring for the first dimension under Measurement Type.
- Check the box for Provide Optimal Range if you'd like to enter an optimal upper and lower value. This range will be displayed in green in the module.
- Check the box for Override Normal Range if you'd like to enter a lower and upper value as normal. This range will be displayed in blue in the module.
- Check the box for Override Absolute Range if you'd like the bounds of your graph to extend beyond the normal range when displaying the data. Enter lower and upper values in the area provided.
- If you'd like to add a second dimension, select the blue + Add Dimension button again. Continue adding dimensions until you are done configuring your module.
- Click Apply. The measurement module will appear in your Subject Viewer layout.
- Click the icon in the header to save your layout for future viewing.
It is important to complete step 9. You must save the layout itself before you navigate away or the module will not be saved to the layout.
Additional Visualizations
After you've entered multiple dimensions, you can select different ways to visualize the data other than Range Slider. The example below illustrates two dimensions: systolic and diastolic blood pressure with Range Slider selected.
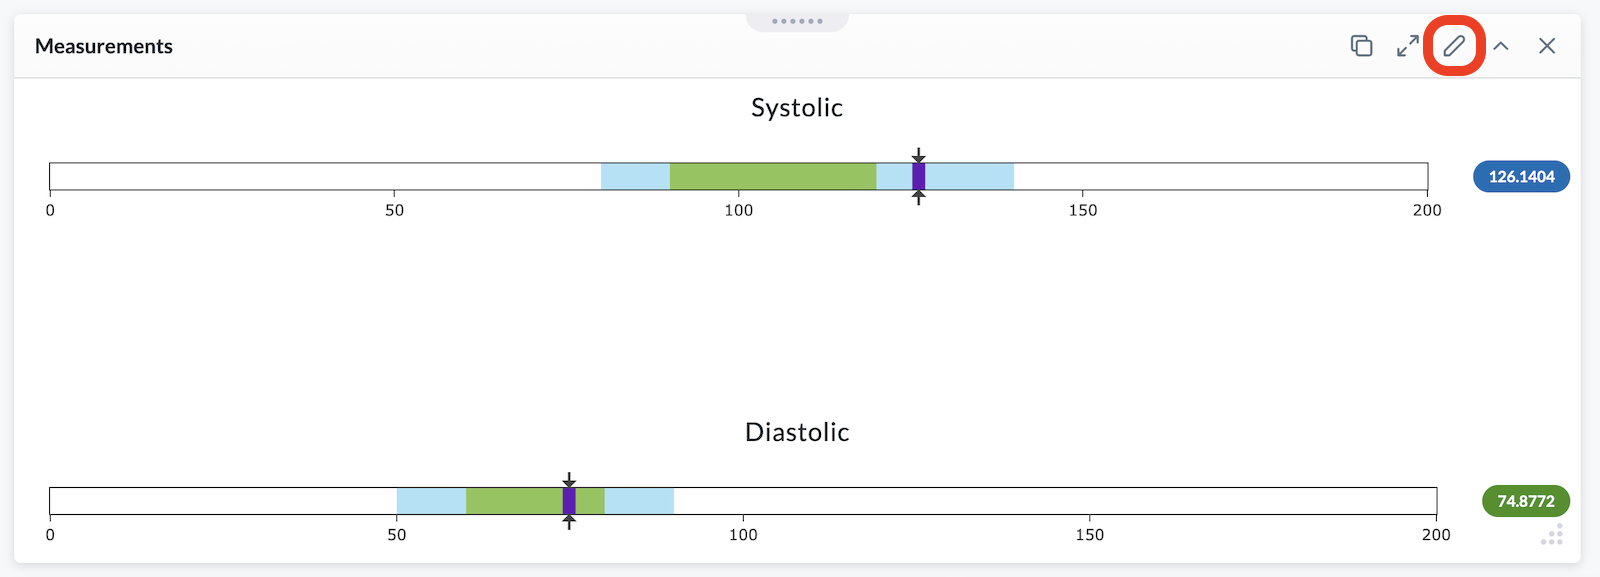
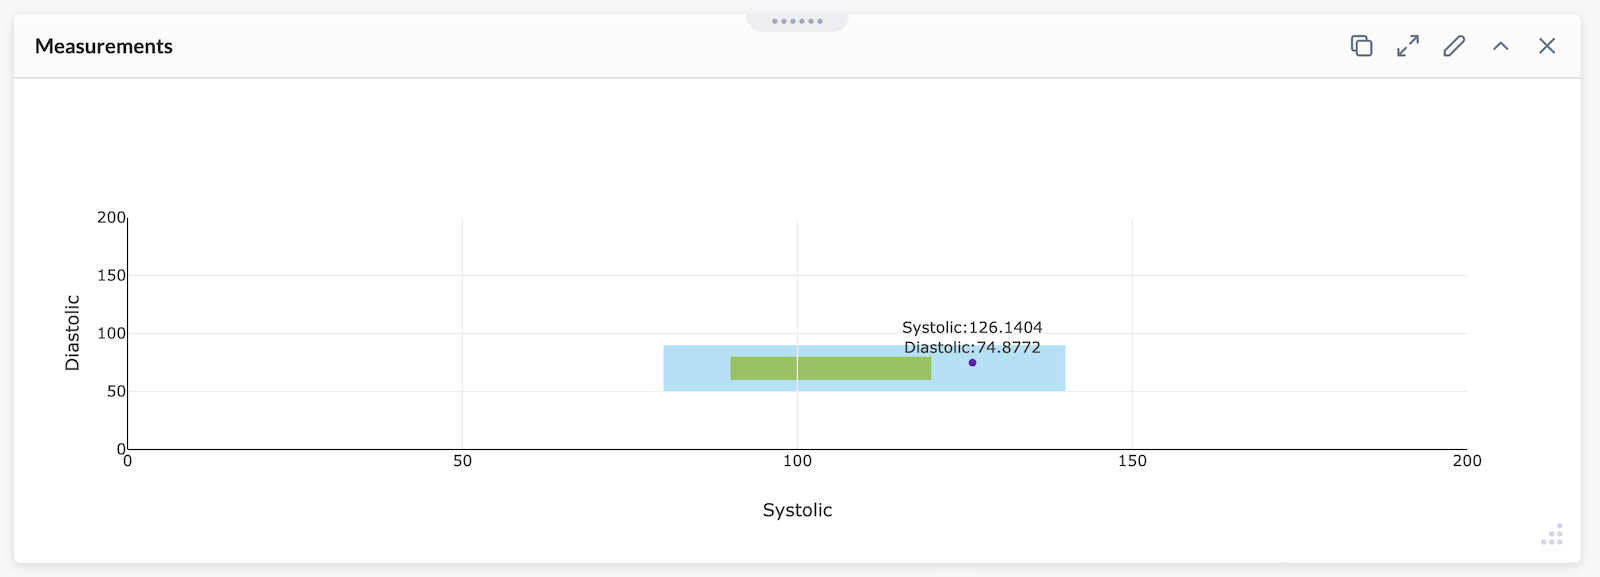
Click on the pencil icon to edit a module with multiple dimensions. If you change the Visualization Type from Range Slider to Cartesian Plot, the module will change to resemble the image below.
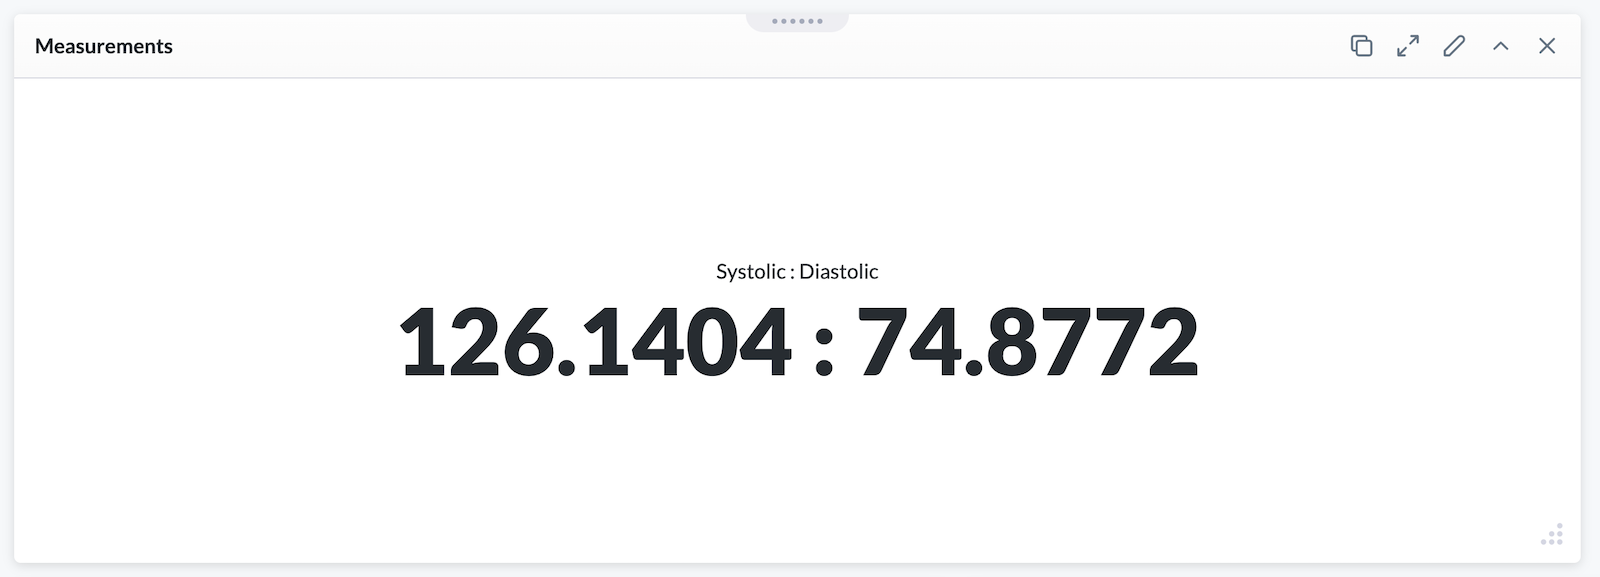
If you have only two dimensions, you can also view them as a ratio by selecting Ratio Display.
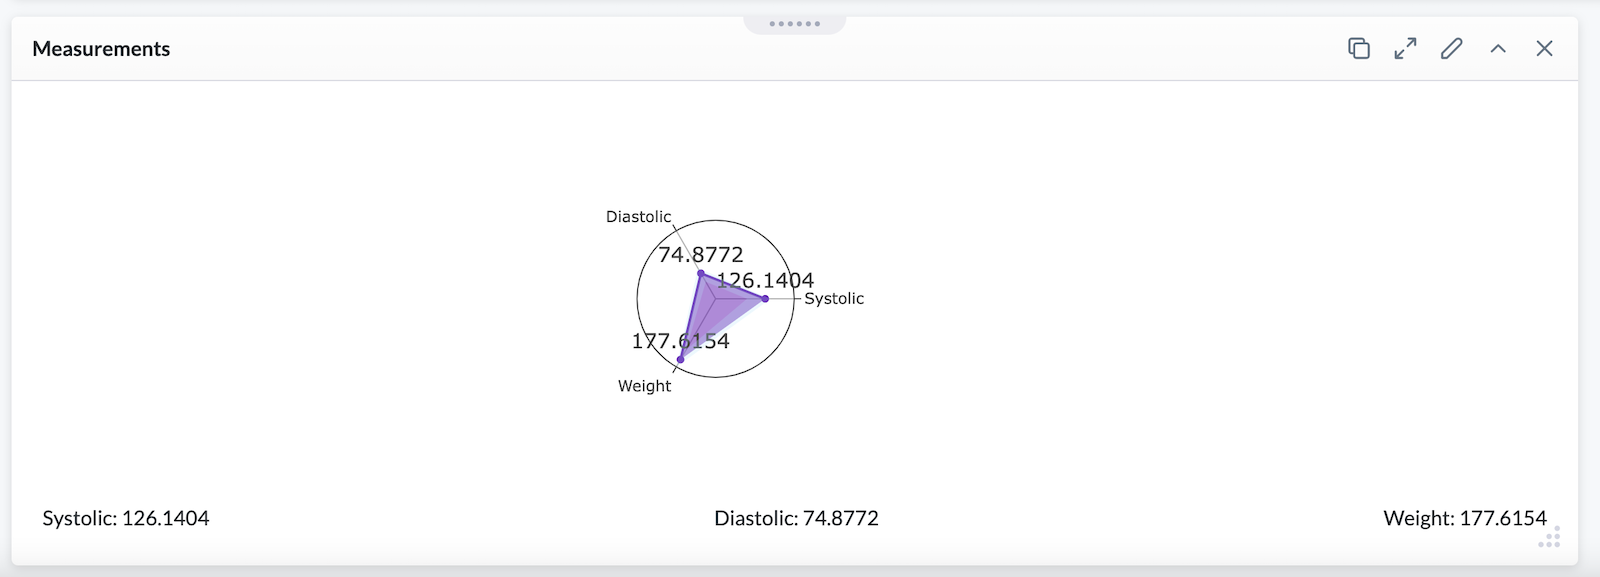
If you add a third dimension, you can view the data as a Polar Plot. Here, the dimension of body weight was added in addition to two blood pressure dimensions.