Machine Learning
The LifeOmic Platform empowers clinicians to efficiently review medical images provided by diagnostic devices using our Patient ML Service feature. Use the LifeOmic Platform to develop and train machine learning models to aid in future diagnosis. Developers can learn more about building machine learning models by visiting the Machine Learning section in the LifeOmic Dev Center. Clinicians can view model training data and label training images using the Machine Learning tab of the LifeOmic Platform, which is explained in more detail below.
You must have the Patient ML project enabled for your account to access the machine learning capabilities. Contact your LifeOmic account representative for more information about this feature.
View Machine Learning Models and Training Data
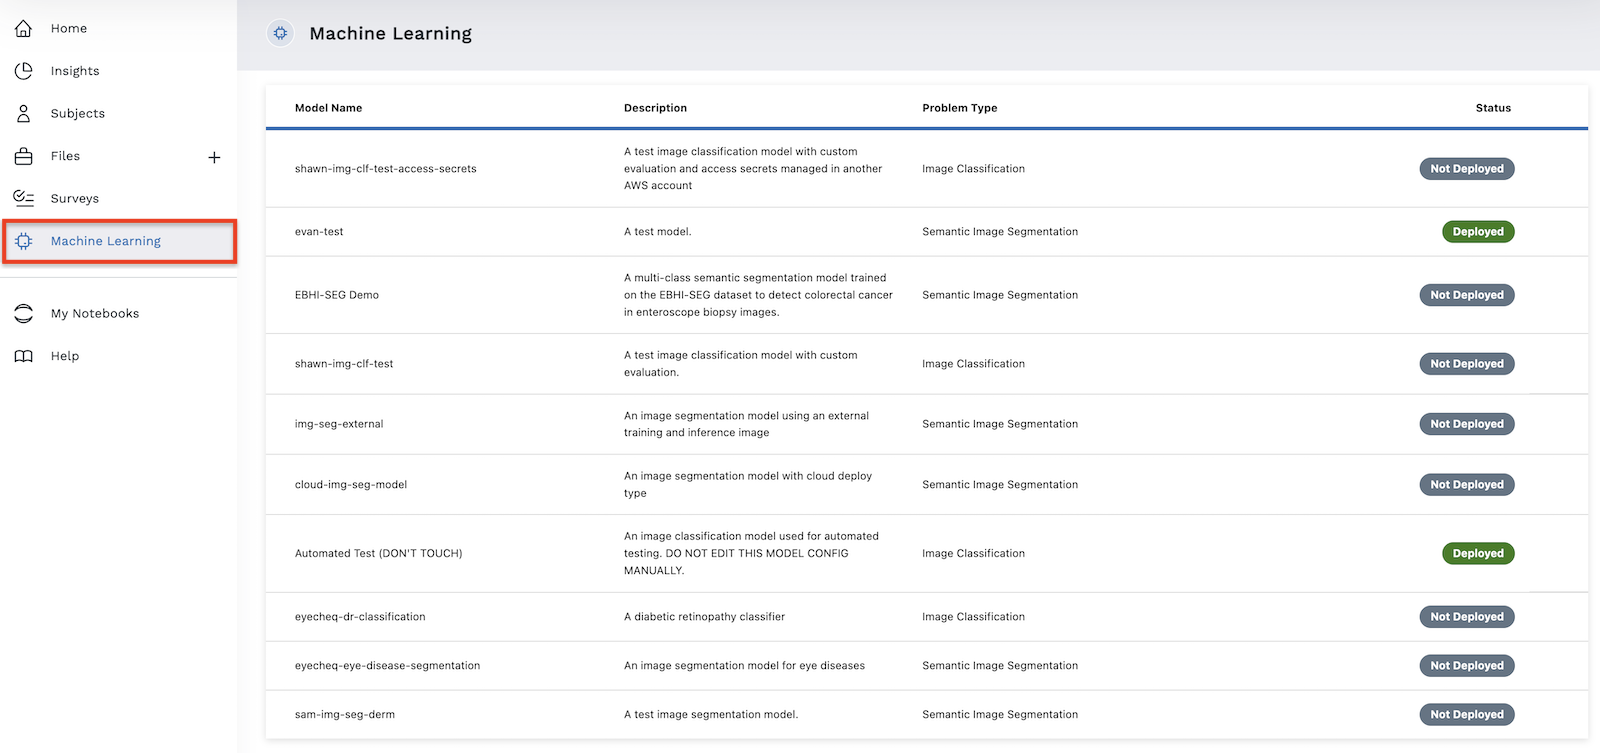
On the left side of the screen, click the Machine Learning tab to view a table displaying model information. The table displays the Model Name, Description, Problem Type, and Status. The problem types we currently support are image classification and semantic image segmentation, but we are exploring the possibility of supporting additional problem types. If the model has been deployed, then Deployed displays in green under Status. Not Deployed displays in gray if the model has not yet been deployed.
Click anywhere on a table row to open the model details view for a specific model. The details view has three tabs: Examples, Runs, and Metrics.
Examples
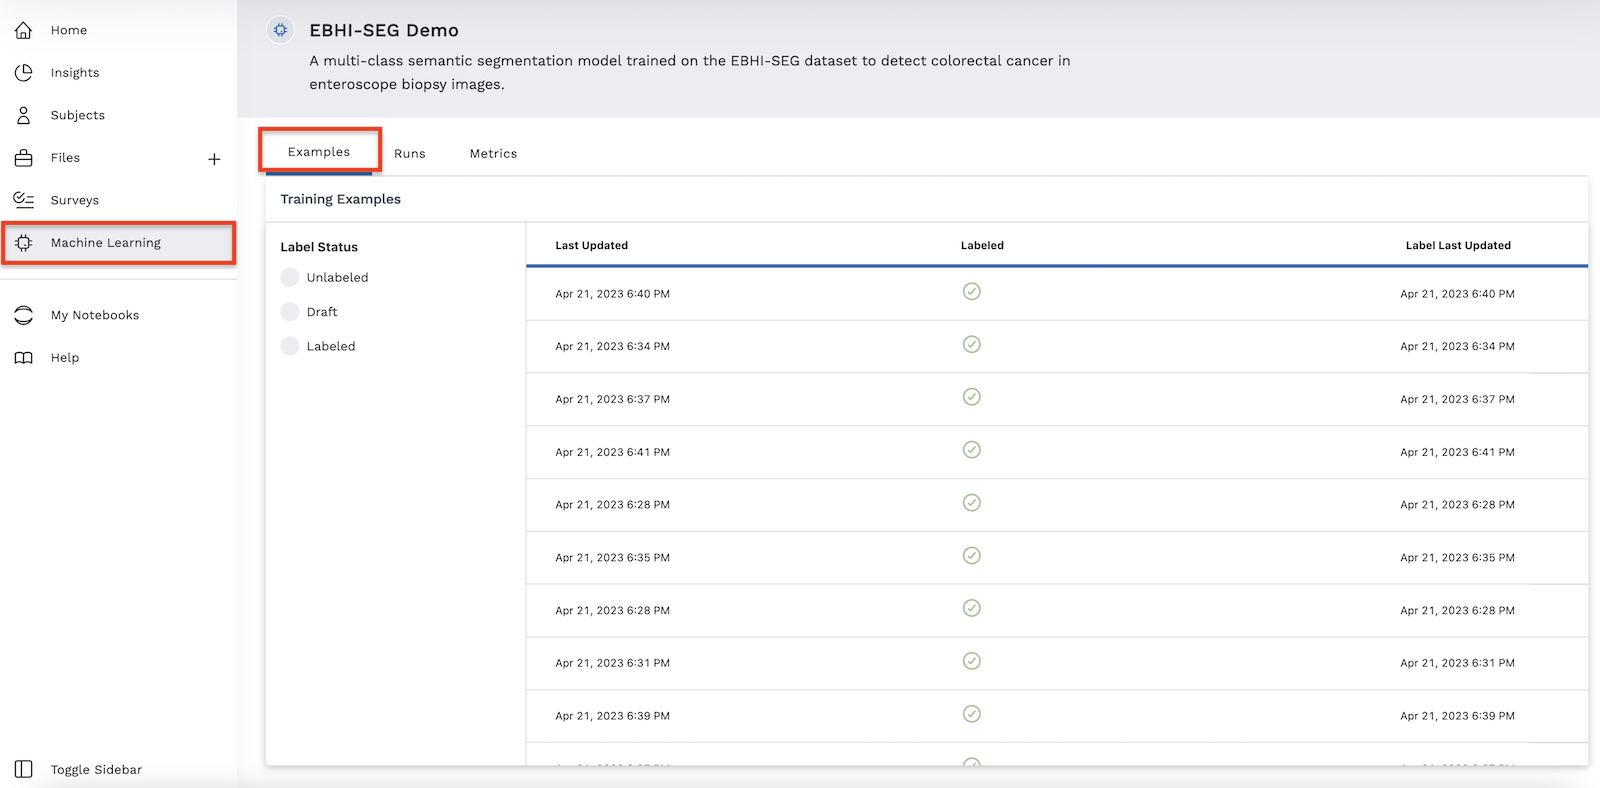
The default tab is Examples. Use this section to view training examples and see more information about their label status. The Example table has three sections:
- Last Updated - displays the date and time that the training example was last updated
- Labeled - a circle with a checkmark denotes a training example that has been labeled. Empty circles denote drafts, and unlabeled training examples are blank.
- Label Last Updated - displays the date and time that the label was last updated
On the left side of the table you can sort by Unlabeled, Draft, and Labeled using the buttons under Label Status.
Click anywhere on the row of a training example to open the data labeling view.
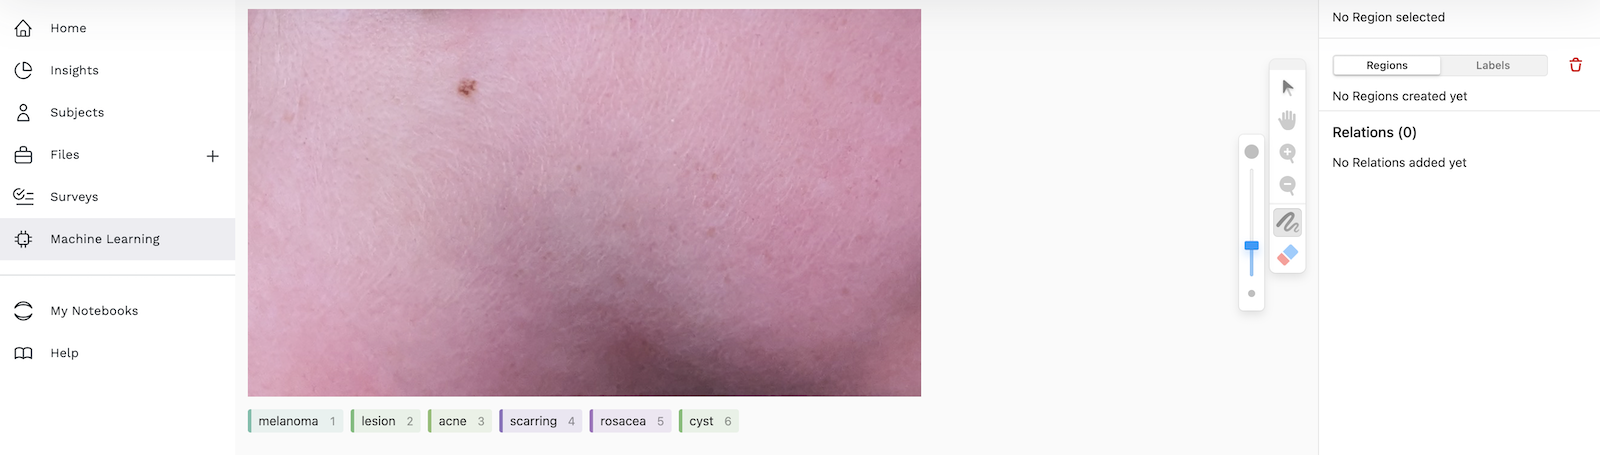
The labeling view shows the training example image. If an image has not been labeled, you can label it here. If it has already been labeled, you can edit or delete the label. The example above is a photo of a patient's skin, which a dermatologist could then label with the correct dermatological condition to assist in training the model.
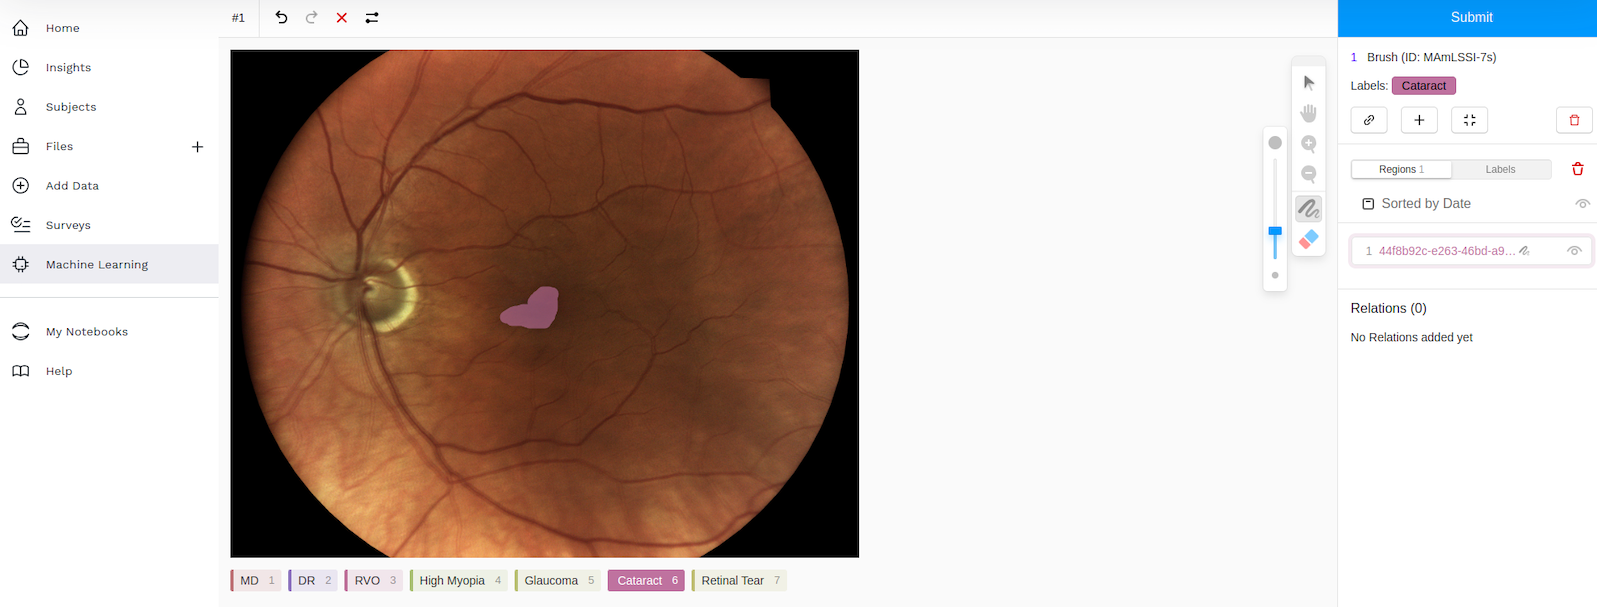
To label an image in the data labeling view for the image segmentation problem type:
- Click on the colored box below the image that corresponds with your desired label.
- Draw on the image to indicate the desired label or region with the marker tool. Use the optional editing tools on the right to zoom in, zoom out, pan, erase, and adjust the size of the editing marker. Click the red trash icon to delete and undo your edits, if needed. In the example below, we used the marker tool to draw on an image of an eye to indicate the location of a cataract (for instructional purposes only; not a medically accurate example.)
- Click the blue submit button to save and submit your label.
After you've submitted the labeled example, the machine learning model will automatically pull the example on its next training run and will train on it. It now displays as Labeled in the Examples section of the table. With significant data, the model will learn to identify conditions based on past diagnoses. Eventually, the model can offer predictions in the data labeling view, helping to make workflow more efficient.
The interface to label training images in the data labeling view is also in a module called the ML Labeler module that you can place in the patient's subject viewer layout. This allows clinicians to navigate from the Subjects section to a subject of interest, then quickly find and label the corresponding training image directly in the subject viewer.
Runs
When you train your model code on the LifeOmic Platform, we orchestrate all the training set creation, run the model code, and evaluate the model. For more information for developers on training and working with machine learning models, visit the detailed section on Machine Learning in the Developer Center.
The Runs section provides a significant amount of details about different versions of your models. Use the Runs table to see all the different metrics that you're outputting about your models, giving you more information to decide if a new model version is delivering better information than the model that is currently deployed.
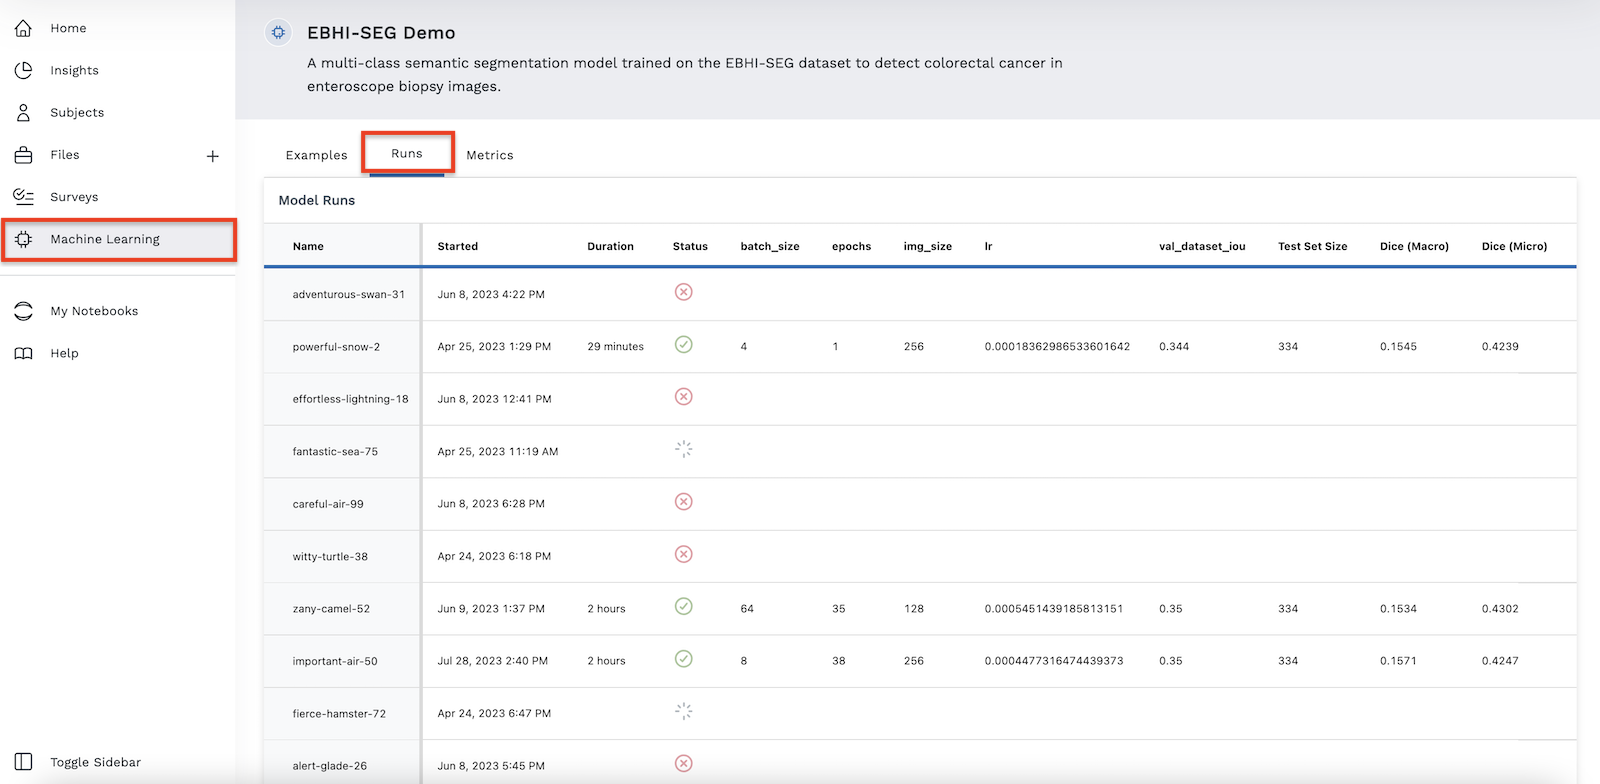
The Runs table displays a great deal of information about the model runs. Under Status, the three possible symbols denote:
- Model run succeeded
- Model run failed
- Model is currenty running
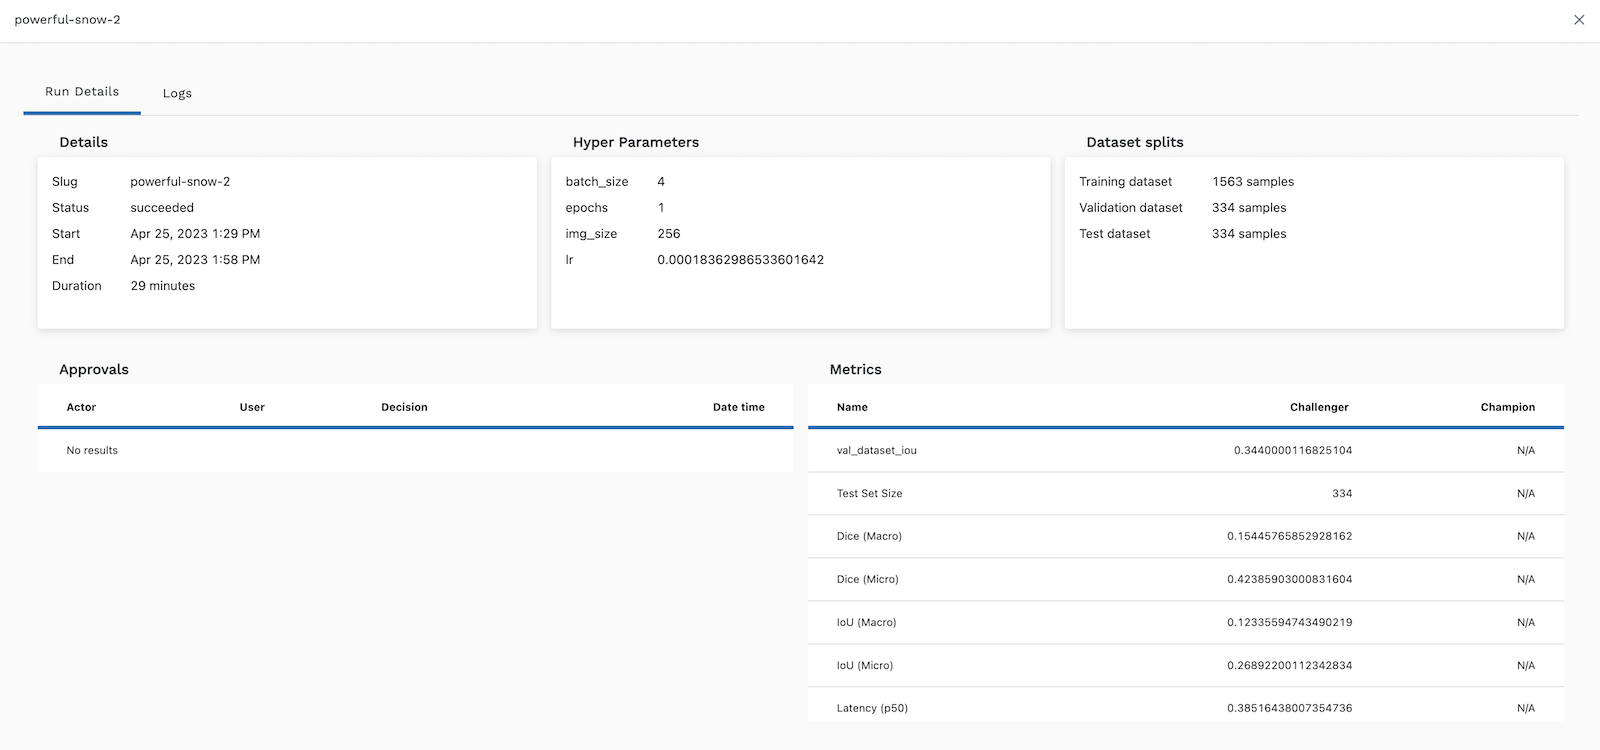
Click anywhere on a row in the Runs table to open a detailed snapshot of run details for a particular model run. Click the X in the top right to close the details and return to the Runs table.
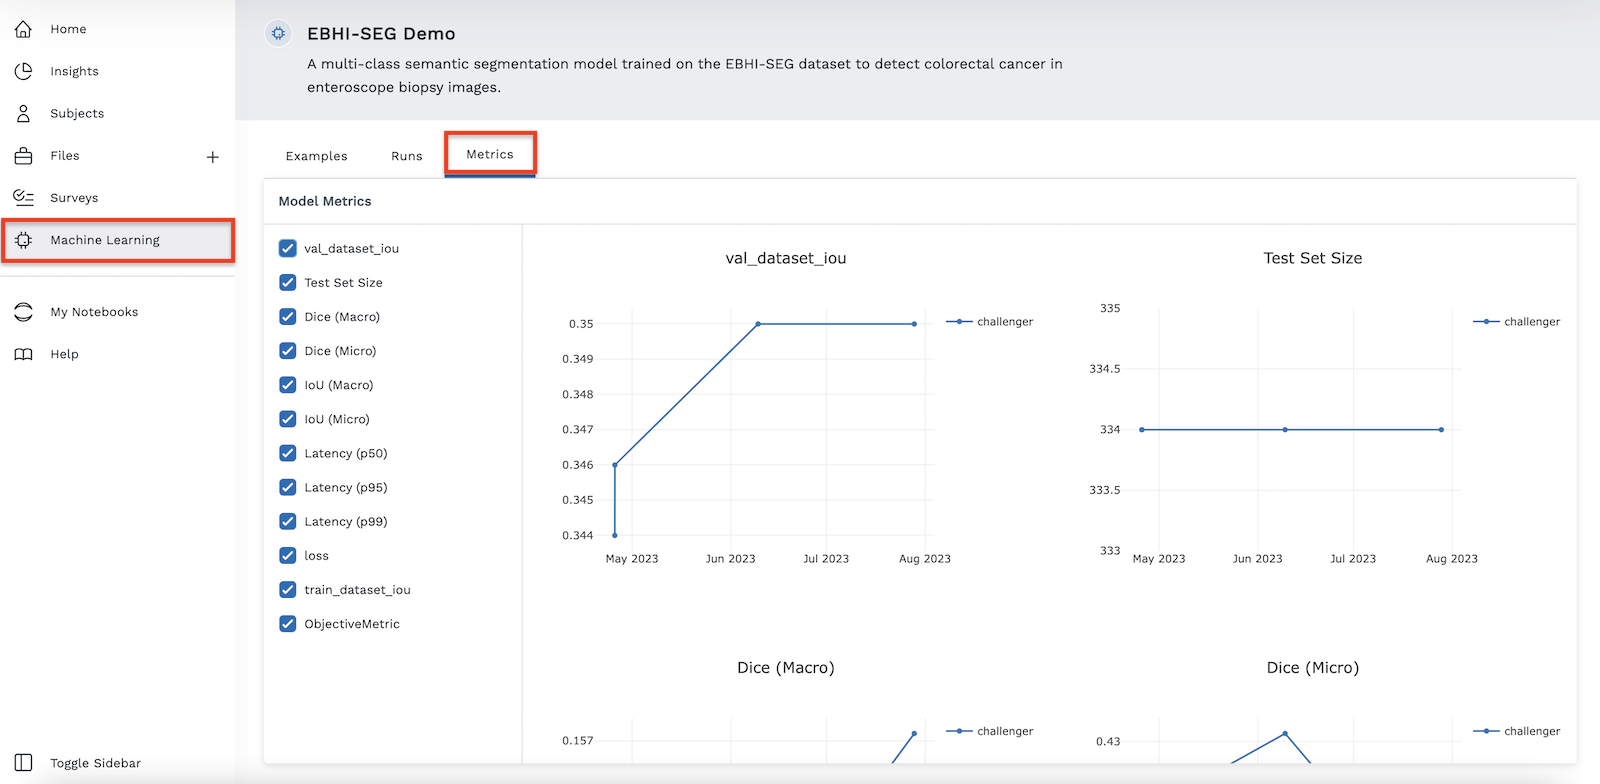
Metrics
Click the Metrics tab to see model metrics displayed in graph form. The Metrics view lets you easily compare data over time by allowing you to visualize model run details. Use the Metrics tab to help decide which model is outperforming the others. You can select or unselect the check boxes on the left side to customize which data to display.