Table Module
The Table Module allows you to display your subject's data in a table format. The types of data you can display in a table include anything from a diagnostic report, a subject's medication administration, or even survey answers.
How to add the Table Module to your layout
- Begin by following the instructions to Add a Module to a Layout.
- From the Build Your Own module page, select the Table tile .
- Set your Table Module settings. Click Apply when finished.
- Click the icon in the layout header to save your layout for future viewing.
It is important to complete step 4. You must save the layout itself before you navigate away or the module will not be saved.
Set/Edit the Table Module Settings
When adding a Table Module to your layout, you'll automatically access the module settings to set the parameters for your table.
To edit settings of existing Table Modules:
- Navigate to the Subject Viewer screen.
- Click on the Edit Layout icon in the header.
- Click on the edit icon of the module you wish to modify.
Table Module Settings
The Table Module settings allows you to set the parameters of your table. You can select what your table is called, what data is displayed, and how many columns are shown.
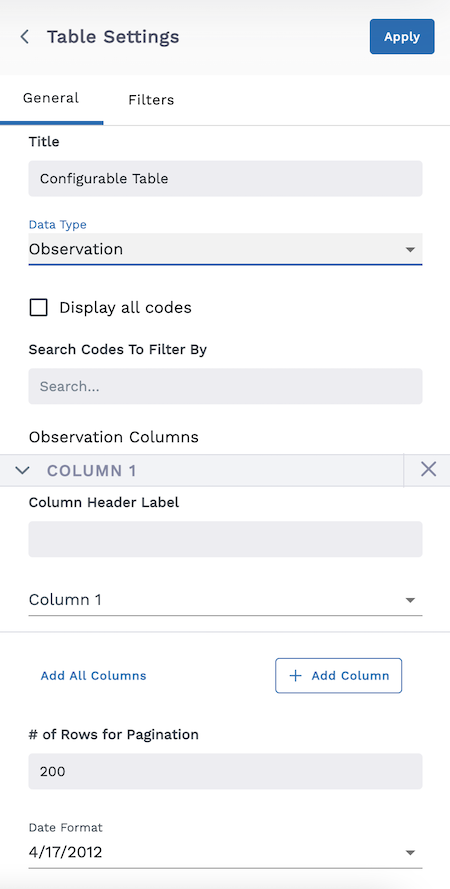
General tab:
-
Title – Give it a name
-
Select your Data Type from the dropdown. Options include:
- Observation - Next, check the Display all codes checkbox OR search for individual codes to filter by in the search box
- Procedure - Next, check the Display all codes checkbox OR search for individual codes to filter by in the search box
- Encounter - Next, check the Display all codes checkbox OR search for individual codes to filter by in the search box
- Condition - Next, check the Display all codes checkbox OR search for individual codes to filter by in the search box
- Medication Request - Next, check the Display all codes checkbox OR search for individual codes to filter by in the search box
- Medication Administration - Next, check the Display all codes checkbox OR search for individual codes to filter by in the search box
- Medication Statement - Next, check the Display all codes checkbox OR search for individual codes to filter by in the search box
- Media
- Document Reference
- Diagnostic Report - Next, check the Display all codes checkbox OR search for individual codes to filter by in the search box
- Medication Dispense - Next, check the Display all codes checkbox OR search for individual codes to filter by in the search box
- Referral Request
- Specimen
- Imaging Study
- Consent
- Procedure Request
- Coverage
- Explanation of Benefit
- Immunization
-
Specify what data columns will be shown in the table. The default presents you with a single column for you to set your parameters (title, data type.)
Table column options include:
- The default column
- Add All Columns button - This will add all data columns available
- + Add Column button - Adds more columns individually
-
Column Header Label – Give your data column a name.
-
Click the Column dropdown to pick the resource to be displayed. Options available depend on the data type chosen.
-
Specify the number of Rows for Pagination.
-
Date Format – Select the desired style from the dropdown menu.
-
Click Apply when you are finished setting parameters.
Move, Delete, or Modify a Column
Columns can be rearranged, deleted, renamed, or switched to a JMESPath Query Value.
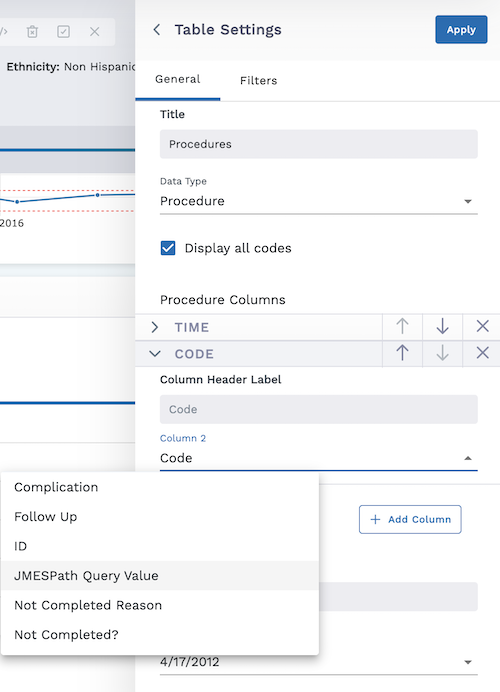
- To change the order of the columns use the arrows.
- To delete a column click the X.
- To change the Column Header Label, click in the textbox and update the name.
- To switch to a JMESPath Query Value instead of the specified column, click the , and select JMESPath Query Value. Scroll down if the JMESPath Query Value option is not immediately visible.
Table Filters and Tagging
Filters tab
The filters tab allows you to further filter your results.
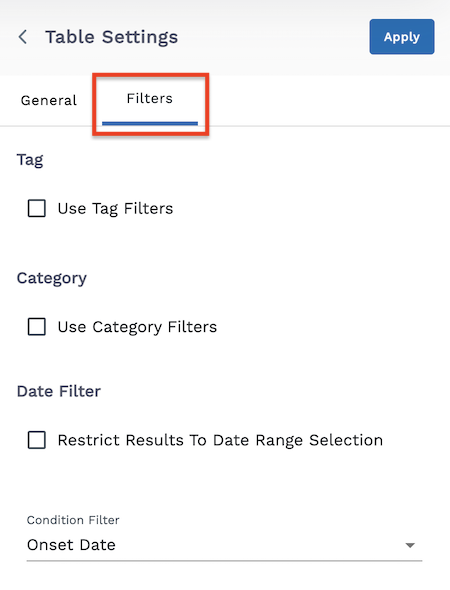
Tag
- Use Tag Filters checkbox - After clicking this checkbox, specify the Tag System and Tag Code. You can click the + Add Tag Filter to add more tag filters.
Category
- Use Category Filters checkbox - After clicking this checkbox, search for the Category Code(s) you wish to use.
Date Filter
- Restrict Results to Date Range Selection checkbox - Click this to restrict the results displayed in the table to be dictated by the Subject Viewer timeline slider. Uncheck this to show data over all time.
Filter dropdown - This dictates what time property the data in the table filters on. Some data types will have multiple options to select from here. For instance, the Conditions data type allows you to select from the table data matching the date filter of either Onset of a condition or the Abatement (ending) of a condition.
Using Tables to Display Wearables Data
Users can integrate a growing number of wearables and medical devices with the LifeOmic Platform. The first step is to configure the LifeOmic Patient Engagement mobile app. The user can then display the wearables data in tables and graphs in their Subject Viewer layout.
Follow these steps to create a table in your Subject Viewer layout that displays data generated from wearables.
- Begin by following the instructions above to add a table module to your layout.
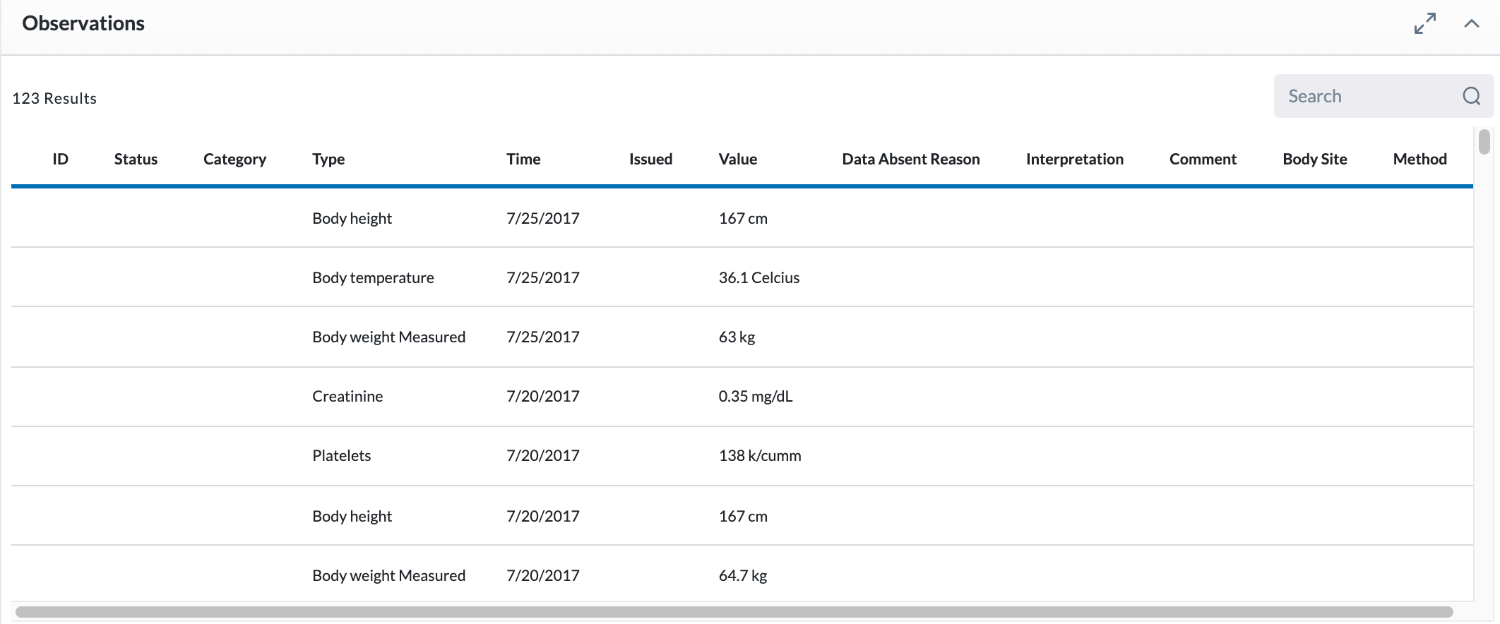
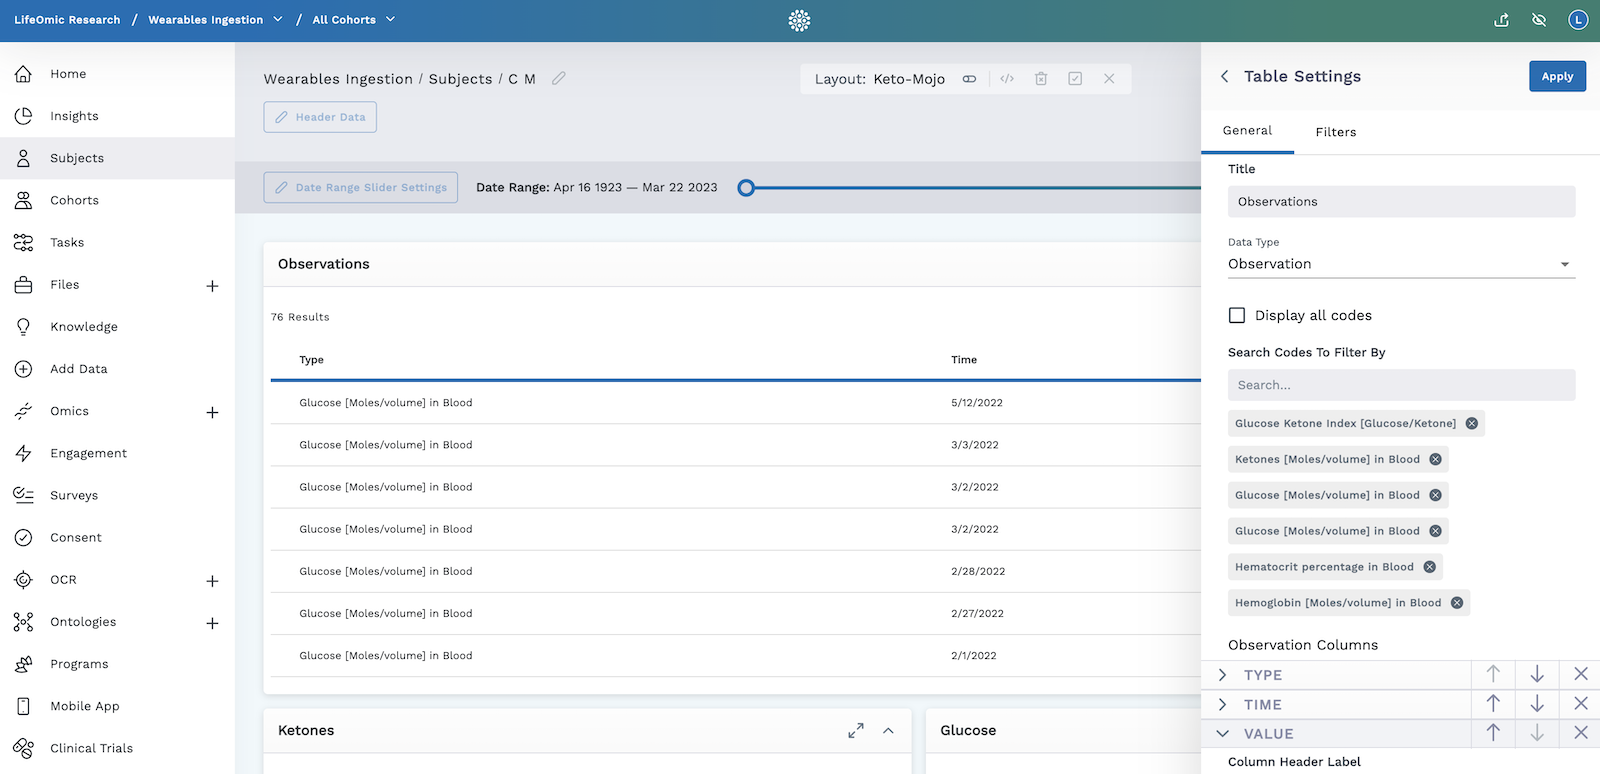
- Give your table a title. In the above example, the table is called Observations.
- Select the Observation data type.
- For filter codes, select the EHR data generated from your chosen wearables device. In the example above, the user selected filters which correspond to glucose measurement in order to display glucose data generated from a Keto-Mojo device.
- There are multiple codes that can correlate to the same unit of measurement. In the example above, the user selected to filter with multiple codes that can correspond with glucose. Wearables from different brands can be coded differently even though the devices are both measuring the same unit. For example, Apple Health weight is a different code than FitBit weight, but they both measure weight. Therefore, it is important to apply all filters for a unit to a table to ensure you are pulling all the data across all desired wearables.
- Configure the observation columns to display type, time, and value.
- Click Apply.
- The table module will appear in the Subject Viewer layout displaying the wearables data in the table you have configured.
- Click the icon in the header to save your layout for future viewing.
It is important to complete step 8. You must save the layout itself before you navigate away or the module will not be saved to the layout.
Some wearables data is more optimally displayed in graph form rather than in a table. For more information about configuring wearables to display in graph form, visit the Graph Module section of the user guide.