Insights Overview
Insights is a page within the LifeOmic Platform where subject data for the entire project population is analyzed and visualized using graphs. You can create custom layouts, selecting from various graphs and defining the criteria for data displayed. These layouts can be saved for other users to easily access via a dropdown menu.
This procedure requires the Administer Layouts permission. This permission is not contained in the default Administrator privileges. To add this permission, see Create a Custom Policy for Access Control.
To visualize the data of a single subject, use the Subjects tab in the sidebar of the LifeOmic Platform app. For more information, see create a layout for a single subject.
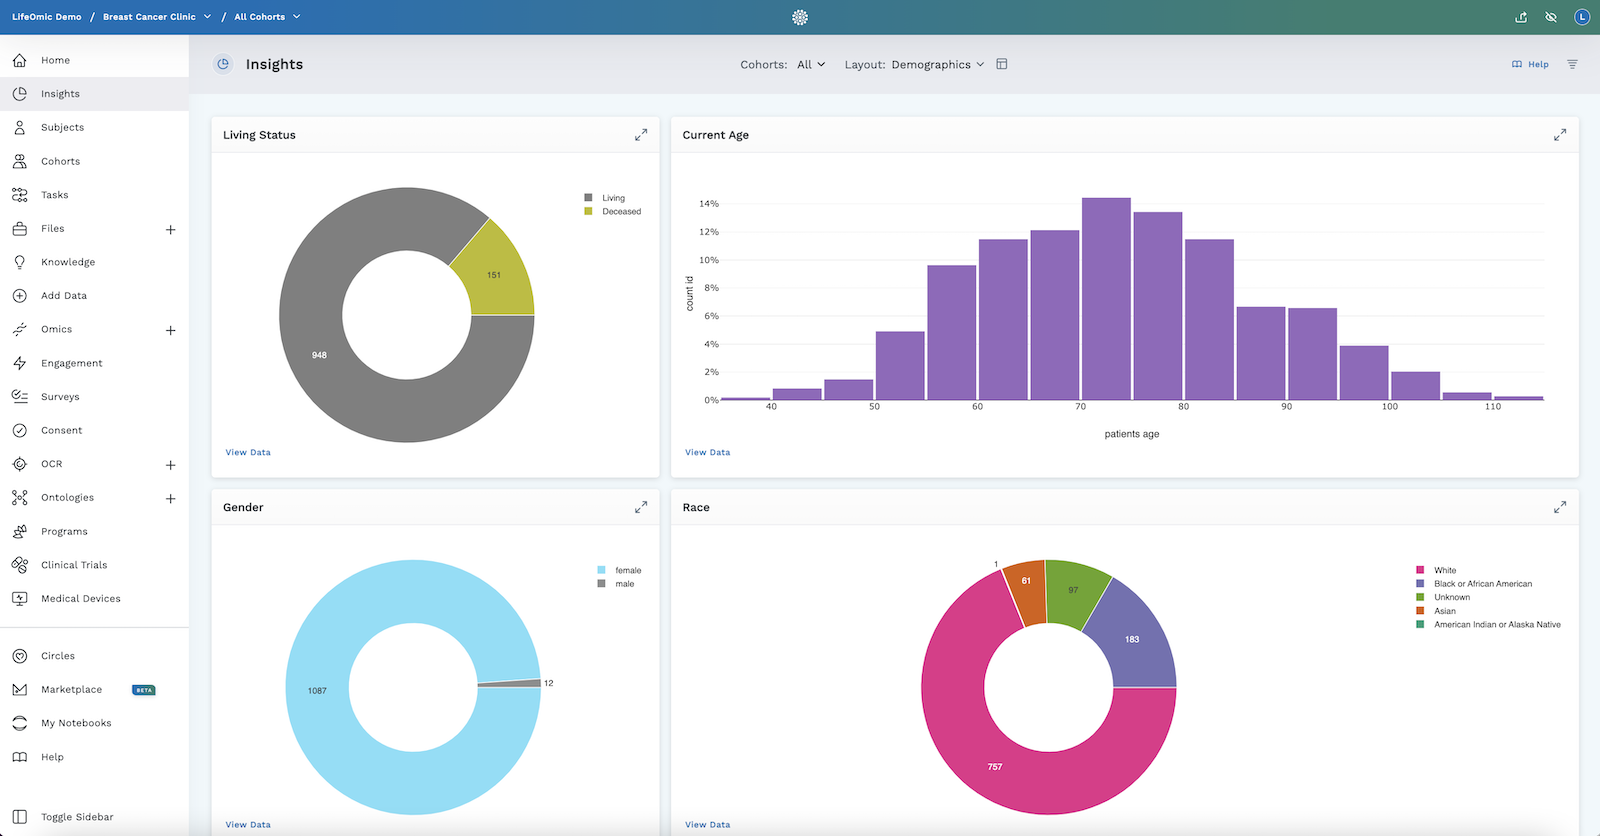
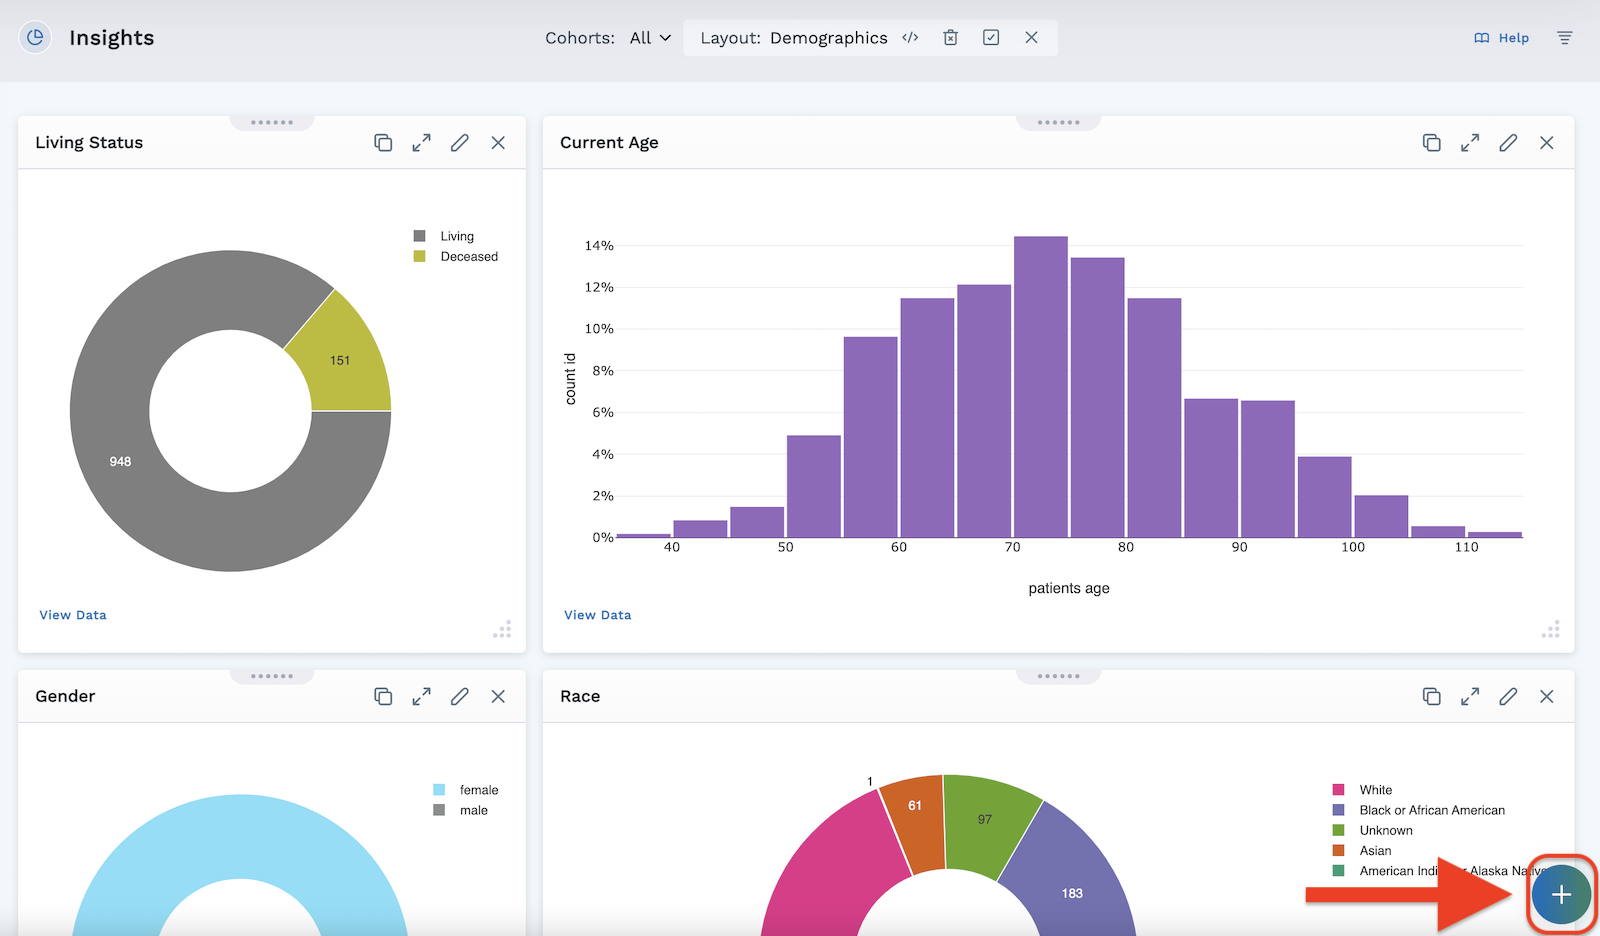
Upon opening the Insights tab, you'll be presented with a default demographic layout consisting of four graphs representing:
- Gender
- Race
- Living Status
- Current Age
Any data from the subjects in your project associated with these four categories is now visualized in graphic form.
This layout cannot be saved or modified. If you create a new layout, this demographic layout disappears. However, deleting all created layouts will return you to this initial demographic layout.
Any "unknown" in the graphed data represents any questions/categories that do not have data associated with it. For example, if a subject does not answer the question asking about their gender, then their gender lists as unknown.
Data from the mobile app may also be viewed in Insights but you must first invite the subject to your organization and they must accept the invite.
Insights Layouts
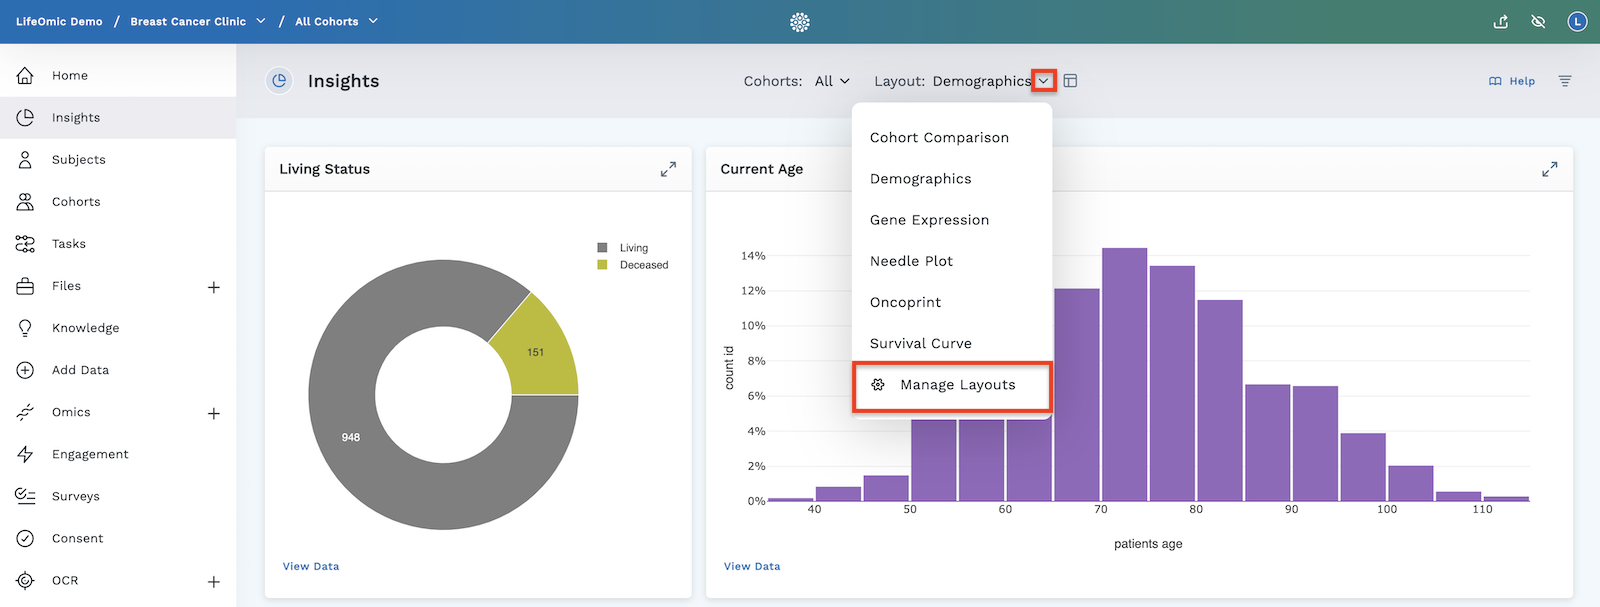
The Layout Dashboard is composed of custom modules (graphs/charts) displaying the subject data you choose and how you want the data visualized. Layouts can be edited after they have been created, though certain admin permissions are needed to be able to create or edit a layout. To select from the alphabetical list of layouts available, click the layout dropdown in the header at the top of the page.
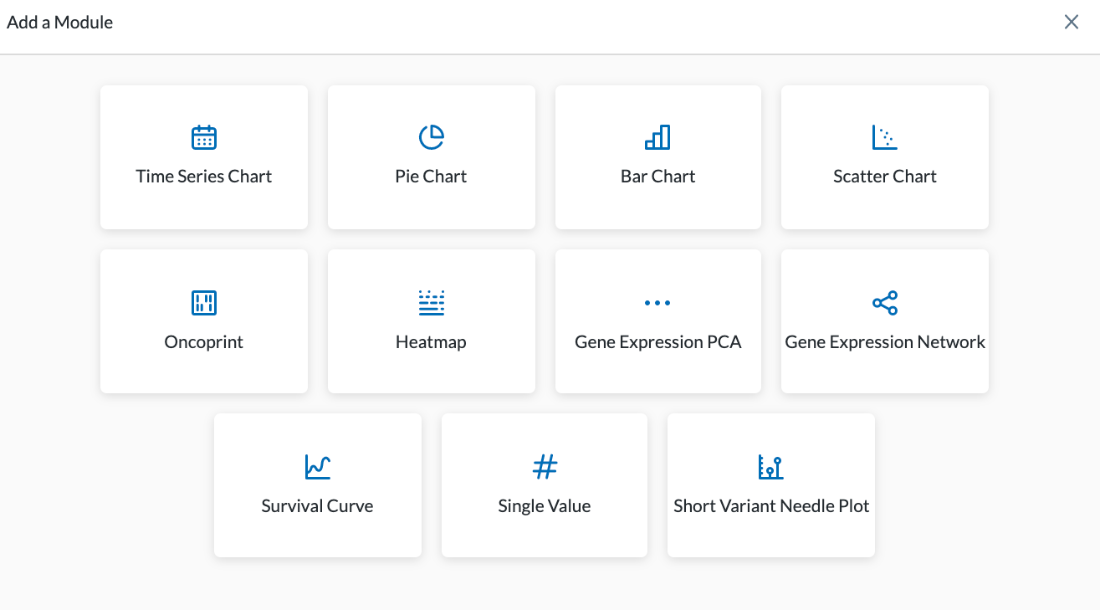
To learn more about modules and see the various module types available, visit the Modules section.
Creating a Layout for all Subjects in a Project
-
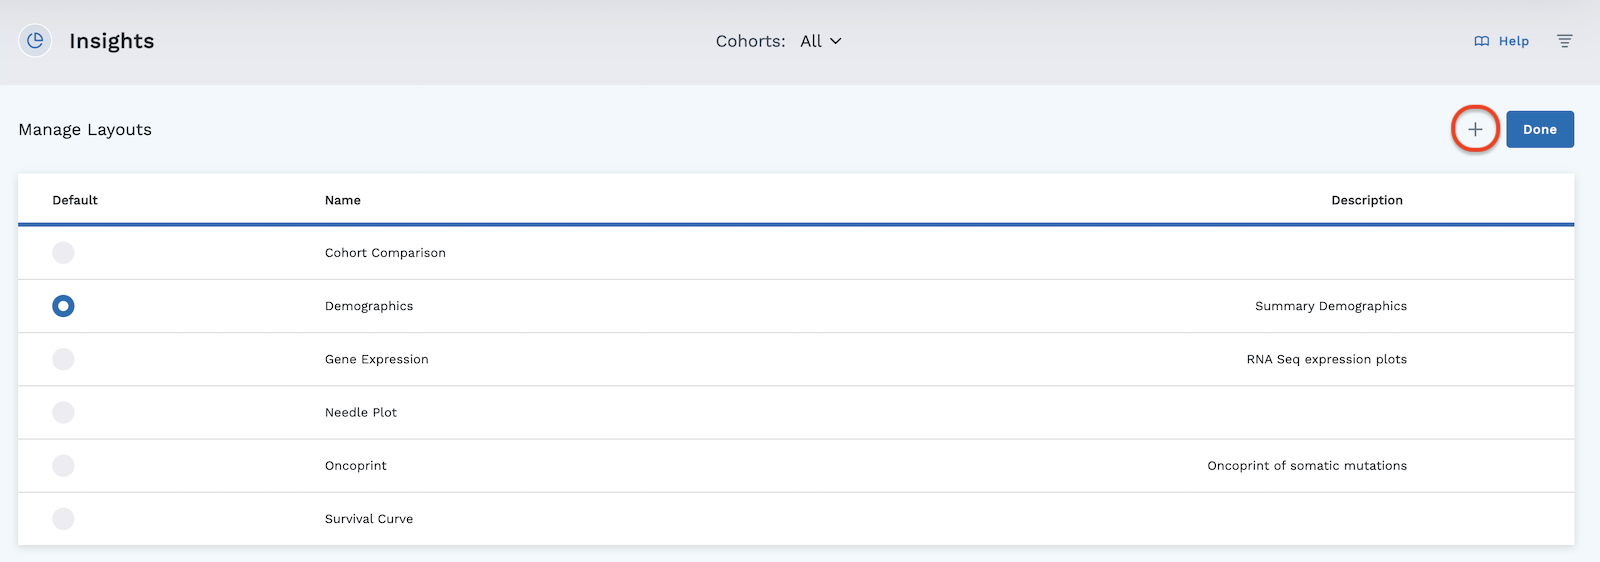
To create a layout, you must navigate to the Manage Layouts page. If no layouts have been created, click the Create Layout button in the header at the top of the page.

If layouts already exist for a project and you'd like to create an additional layout, click the arrow to access the dropdown, and then select Manage Layouts. This will open the Manage Layouts page.
 Here you can create a new layout, delete a layout, change a layout's name and description, copy a layout, or set a layout as default.
Why make multiple layouts? You may want to display different data depending on who is viewing the data. One layout may be to show patients, another may be used for researchers to compare success of treatments based on genetic mutation. Also, creating additional layouts in Insights allows you to present different sets of data on different layout pages (for example, demographic data layout versus pain rating data layout.)
-
Click the Add Layout icon in the top right of the Manage Layouts screen to add a new layout. You can create multiple layouts.
-
Name your layout in the window that opens.
-
Give a description for your layout (optional). This description will only be visible on the Manage Layouts page.
-
Click the Create button. This will take you to back to the Manage Layouts page.
-
Click Done to navigate to a blank layout dashboard where you will add your modules. The name of your newly created layout is visible in the header at the top of the page.
-
To the right of the layout name are two icons:
-
Expand allows you to switch between all layouts available or select Manage Layouts from the dropdown.
-
Edit Layout - allows you access to the Add Module button as well as opens a toolbar with other options to edit your current layout.
-
-
Click Edit Layout . This opens the configure tools (Raw edit, Discard, Edit, and Close) as well as gives access to the Add Module button .
-
Click the circle button to add modules/graphs to your layout.
Edit Layout
Clicking the Edit Layout icon in the header of the Insights tab allows you access to the following:
-
Add Module button (found in the bottom right of the screen)
-
Edit Layout Toolbar (opens upon clicking the Edit Layout icon in the header)
-
Raw Edit - Here you can view and copy the JSON code of the current layout. This is helpful if you want to copy a complex layout you created in one project and place a copy of it in another project.
- Click the Raw Edit icon.
- Click the Copy to Clipboard button at the bottom of the screen with the JSON code.
- Click the "X" in the top right corner of the JSON code screen to leave that screen.
- Click to a different layout or a layout in a different project.
- Click the Raw Edit in this current layout.
- Select all the code on the screen (to delete existing layout) or add the copied layout to an existing layout by clicking the screen in the location you want to add the new layout.
- Paste the code onto the page using ctrl+v (Windows) or cmd+v (Mac).
- Click Save at the bottom of the screen.
- It will take you to the Layout Dashboard and will apply any data in the current project that applies to the newly added layout modules.
-
Clear - This will clear your entire patient viewer dashboard.
-
Save Changes - This saves any changes you've made to the existing layout.
-
Cancel - Cancels anything you've added since your last save and takes you out of the Edit Layout menu.
-
Add, Copy, Delete, or Publish a Layout
The Manage Layouts page of Insights is where you can add, copy, or delete a layout, edit the name and description of a layout, or set a layout as the default. You can also publish it to the Marketplace. The Manage Layouts page can be accessed by clicking the expand icon found beside the current layout name in the header. Manage Layouts displays all created layouts for this project. The blue and green hover buttons appear when you place your cursor on the layout row.
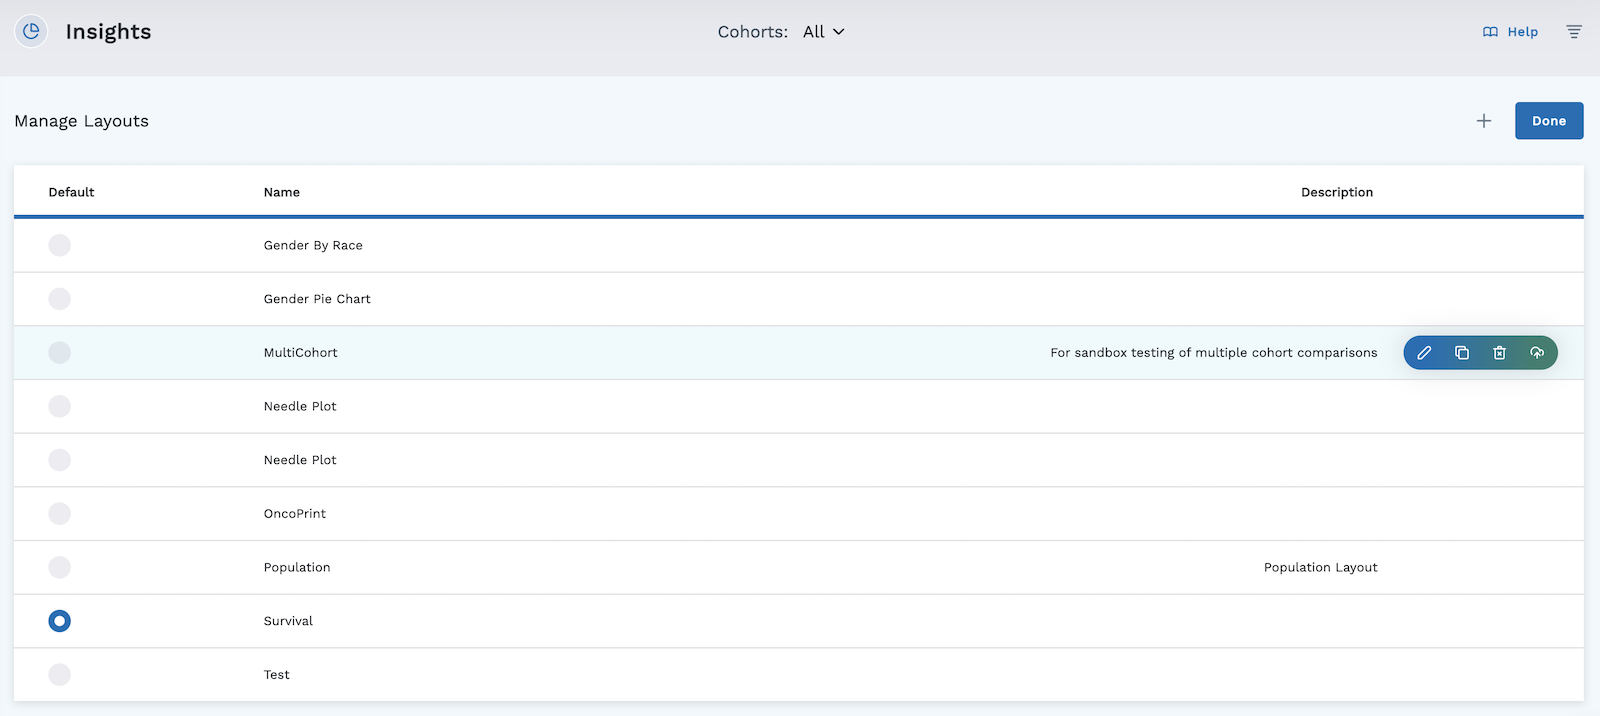
On this page, you can:
-
Add a new layout by clicking the plus sign at the top right of the page.
-
Admins can set the Default layout by clicking the button to the left of the layout you wish to set as default.
The default layout is the one new users will be presented with the first time they open Insights. Existing users will be presented with the layout they most recently viewed in Insights.
-
Edit the title and description of a layout.
-
Copy a layout.
-
Delete a layout.
-
Publish a layout to the Marketplace. After clicking Publish, a dialog box appears asking "Are you sure you want to publish the (layout name) layout to the marketplace? This will make the layout available to all other accounts." Click Publish again to finalize publication to the Marketplace, or click Cancel. To learn more about working with layouts in the Marketplace, visit the Marketplace Overview.
Copying a Layout
You can copy an existing layout by clicking on the Raw edit icon . This allows you to access the JSON code for the modules on the layout page.
How to Copy a Layout from One Project to Another:
-
Click the Edit Layout icon in the layout you want to copy.
-
Click the Raw Edit icon.
-
Click "Copy to Clipboard" at the bottom of the page.
-
Click the Close icon in the top right corner of the screen to close the Raw edit.
-
Navigate to the project you want to paste the layout into.
-
Go into Insights and create a new layout or choose the layout you want to paste the JSON code into.
-
Click the Edit Layout icon.
-
Click the Raw Edit icon.
-
Select the existing code and delete it (optional) and/or click the cursor on the screen beneath "Configuration JSON" and ++ctrl+v++ (Windows) or ++cmd+v++ (Mac) to paste the copied JSON code.
-
Click Save at the bottom of the screen. This will show you the same layout using the data in the current project.
There is also availability to copy a layout in the Manage Layout screen. Here you would duplicate with a copy function.
-
Clear - Clears the entire layout page. You are presented with the following warning: "Are you sure you want to reset your patient viewer dashboard?"
-
Save Changes - Saves your progress (use this often). If you click on the Cancel icon before saving your progress, you will lose it all.
-
Cancel - Cancels anything you've modified since the last time you clicked the Save Changes icon.
To add a module, click on the add button at the bottom right of the screen. It opens a selection window where you can select the module you wish to add. To learn more about modules and see the various module types available, visit the Modules section.
Cohorts
Cohorts are subsets of the whole and are useful for filtering out the data
visualized in an Insights graph. Only individuals with the Create Data
privilege can create a cohort for the project. An
example of a cohort is, "all living men, ages 20-45, who are Caucasian and
diabetic." Selecting this cohort will display data from only the subjects in the
project that meet the criteria defined in the cohort. Any cohort saved in your
project will be available in the Cohort expander in the header of Insights. The
cohorts you choose in the Cohorts expander are not saveable, meaning, if you
click away from your Insights layout, you will have to click on the Cohorts
expander in the header and reselect the cohorts you wish to compare in all of
the modules.
In Insights, you can select up to 4 cohorts, or up to 3 cohorts and "all" (all is not a cohort, all is everybody in the project). Selecting more cohorts than what is allowed will cause the last one selected to be rejected with the following message:
"The graph is limited to 4 cohorts."
To resolve this, remove any cohorts needed to comply with the limit.
You can check the cohorts created for the project in the Cohorts tab or by clicking on expand icon for Cohorts in the header at the top of the Insights page.
Example of Selecting Different Cohorts in Insights
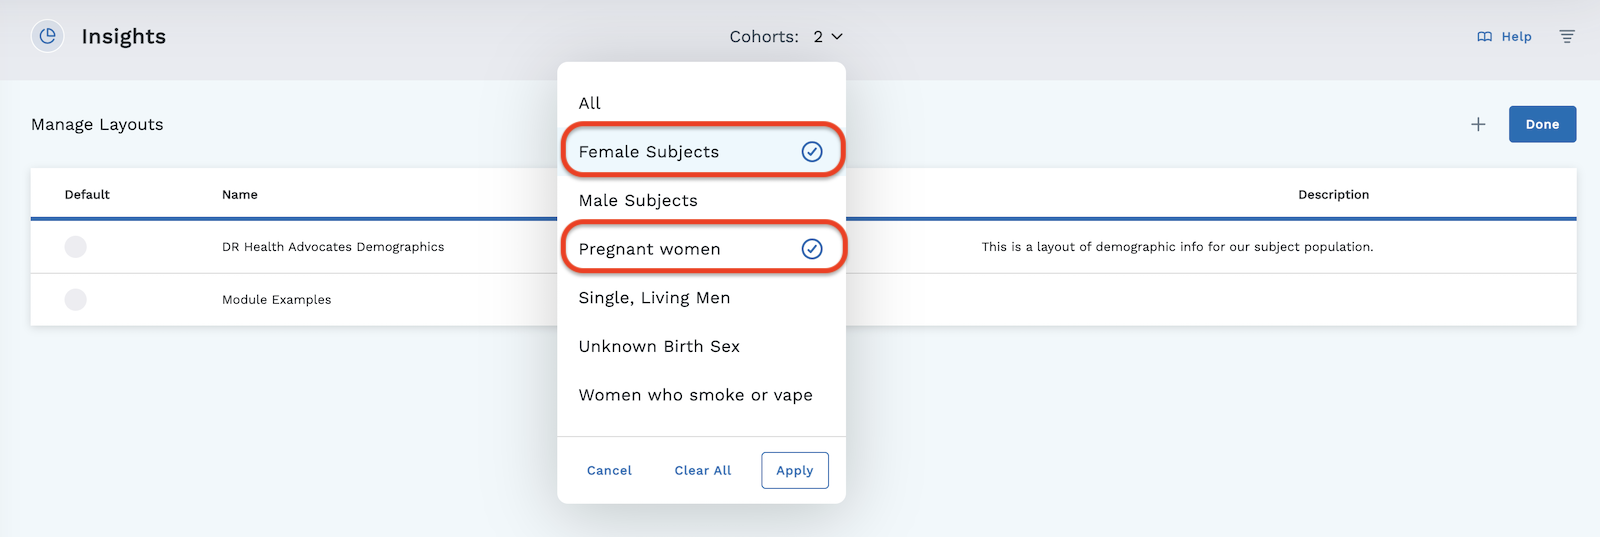
Selecting different combinations of the available cohorts and clicking Apply will cause the graphs to redraw to represent the data called forth in the selected cohorts. If you select multiple cohorts, your pie chart modules will draw a pie chart to represent each cohort.
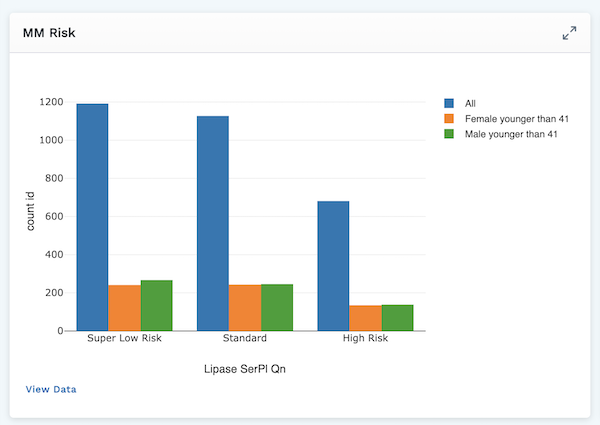
Not all modules can display multiple cohorts. Bar, Scatter, Pie, and Line charts all have the ability to reflect multiple cohorts.
The example below shows a bar graph with three cohorts chosen: All, Female younger than 41, and Male younger than 41. Each cohort is represented by a different colored bar.
Filtering
Filtering using the filter icon located in the header of the Insights tab, is useful when you have a more complicated query than what is offered in Subjects Advanced Filter. This is not often used because the subset it creates is temporary and you cannot create a cohort to be used repeatedly from the subset.
To Perform a Complex Filter Query:
- Click the filter icon .
- Type a command (for example, patients.demographics.gender=female).
- Click Apply Filter.
The more common practice is to use the Subjects Advanced Filter where you can create a complex filter and save it as a cohort to be used throughout your project.