CGM Data Module
If the subject is wearing a Continuous Glucose Monitoring (CGM) device, you can add a CGM module to the Subject Viewer layout that displays the data in a variety of ways. CGM data is uploaded to the LifeOmic Platform through syncing the CGM device with mobile LIFE apps that integrate with the LifeOmic Platform, such as the mobile app. The device must be configured and synced with the LifeOmic Platform for the data to display in the module.
Add a CGM Data Module
-
Begin by following the instructions to Add a Module to a Layout.
-
From the Build Your Own module page, select the CGM Data tile .
-
Configure your CGM settings.
- Give your module a title. The default is "CGM Data."
- Use the drop down menu to select the Display Mode. Choose between Graph, Stats, Notes, and Goal. See the detailed section below for a description of the different display modes.
- Select the range for displaying the data by entering a lower and upper bound.
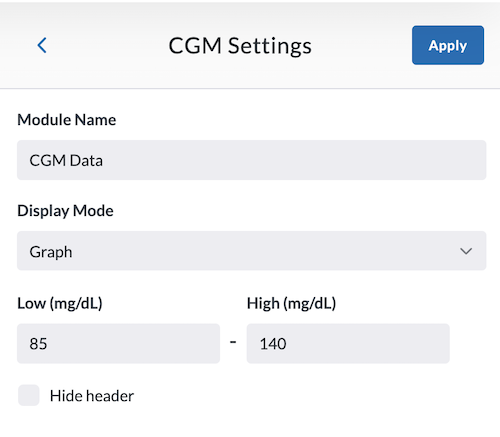
-
Click Apply. The module will appear in your Subject Viewer layout showing the CGM data.
-
Click the icon in the header to save your layout for future viewing.
It is important to complete step 5. You must save the layout itself before you navigate away.
Display Modes
There are four different ways to display CGM data in a module. You can modify the display by accessing the CGM settings and changing the module. The settings automatically display when you create a CGM module, or you can access it by clicking the edit icon on an existing CGM module.
If you'd like to display all four modes at once in the Subject Viewer layout, you can add the module four times, selecting a different display mode each time.
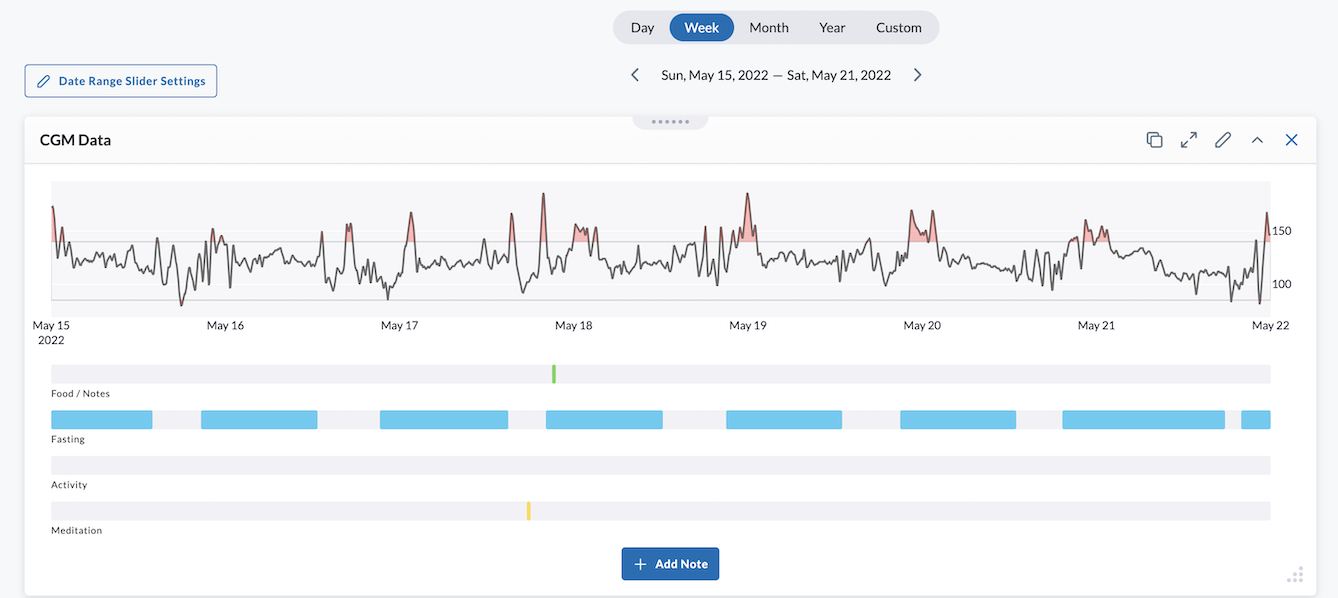
Graph Mode
Select Graph Mode to see the data displayed in a graph with the lower and upper bounds you configured in the settings. Areas that are out of the goal range are shaded orange. The date range is shown above the graph. Use the arrows to change the dates displayed in the graph.
In the example below, the subject's data has been synced with the LifeOmic Platform through the mobile app, and the module also displays the lengths of the subject's self-reported intermittent fasting (shown in blue.) There are also areas to show meditation and any notes the subject has entered that might help explain variations in glucose levels.
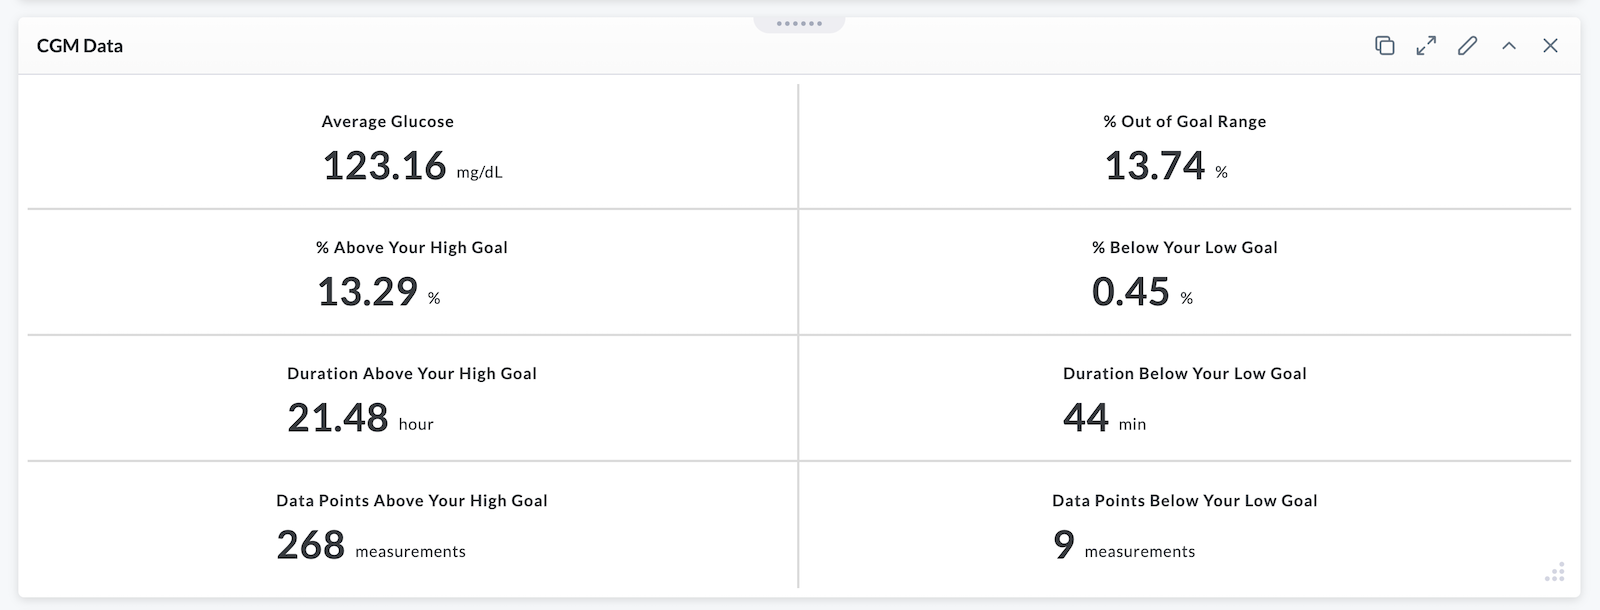
Stats Mode
The Stats Mode shows a summary of statistics to help the user analyze the CGM data over a given date range.
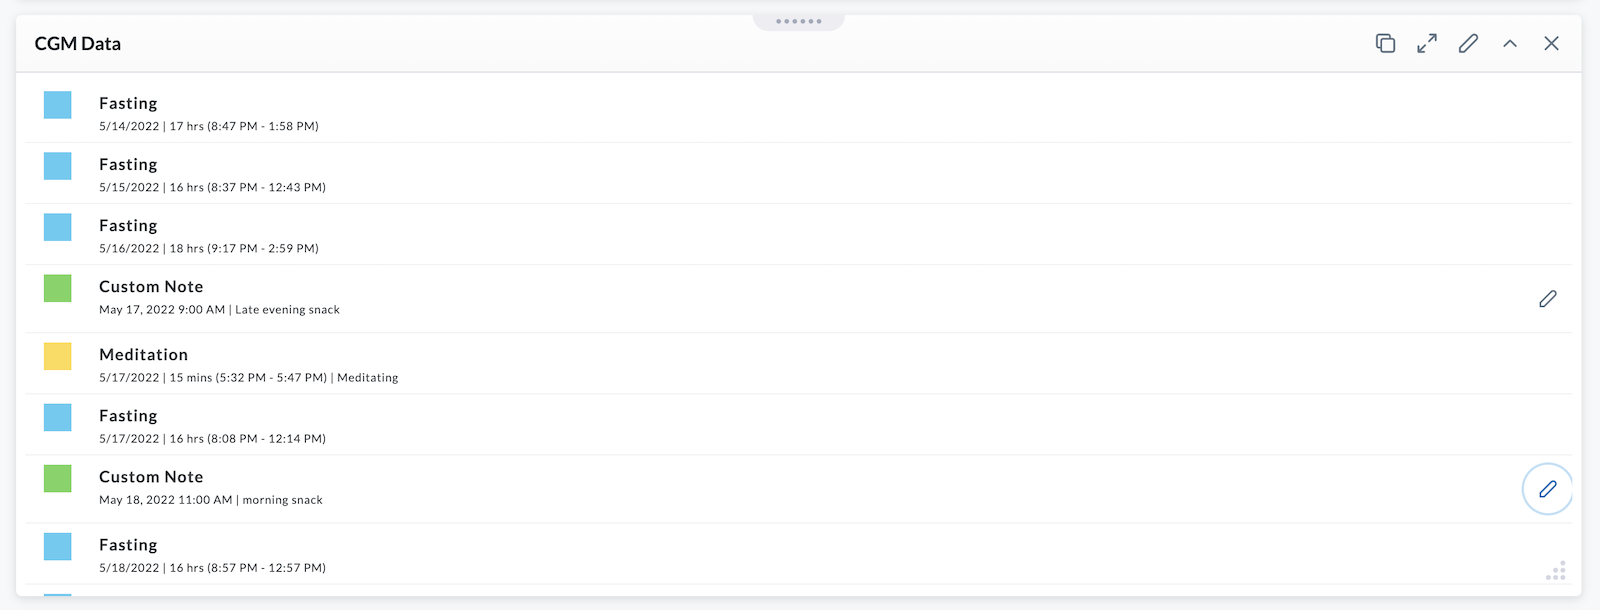
Notes Mode
The Notes Mode displays a table with the custom notes entered by the subject and also the meditation and fasting data pulled from the synced LIFE apps.
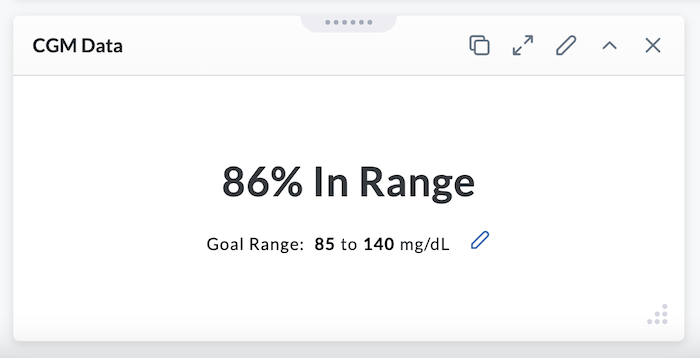
Goal Mode
You can use Goal Mode to show the percentage of time the subject is in their desired goal range. This mode displays just one data point to show a quick snapshot into how well the subject is staying within the predetermined glucose range.