Timeline Module
The timeline provides an alternative, interactive version of a patient overview.
Add a Timeline Module
-
Begin by following the instructions to Add a Module to a Layout.
-
From the Build Your Own module page, select the Timeline tile .
-
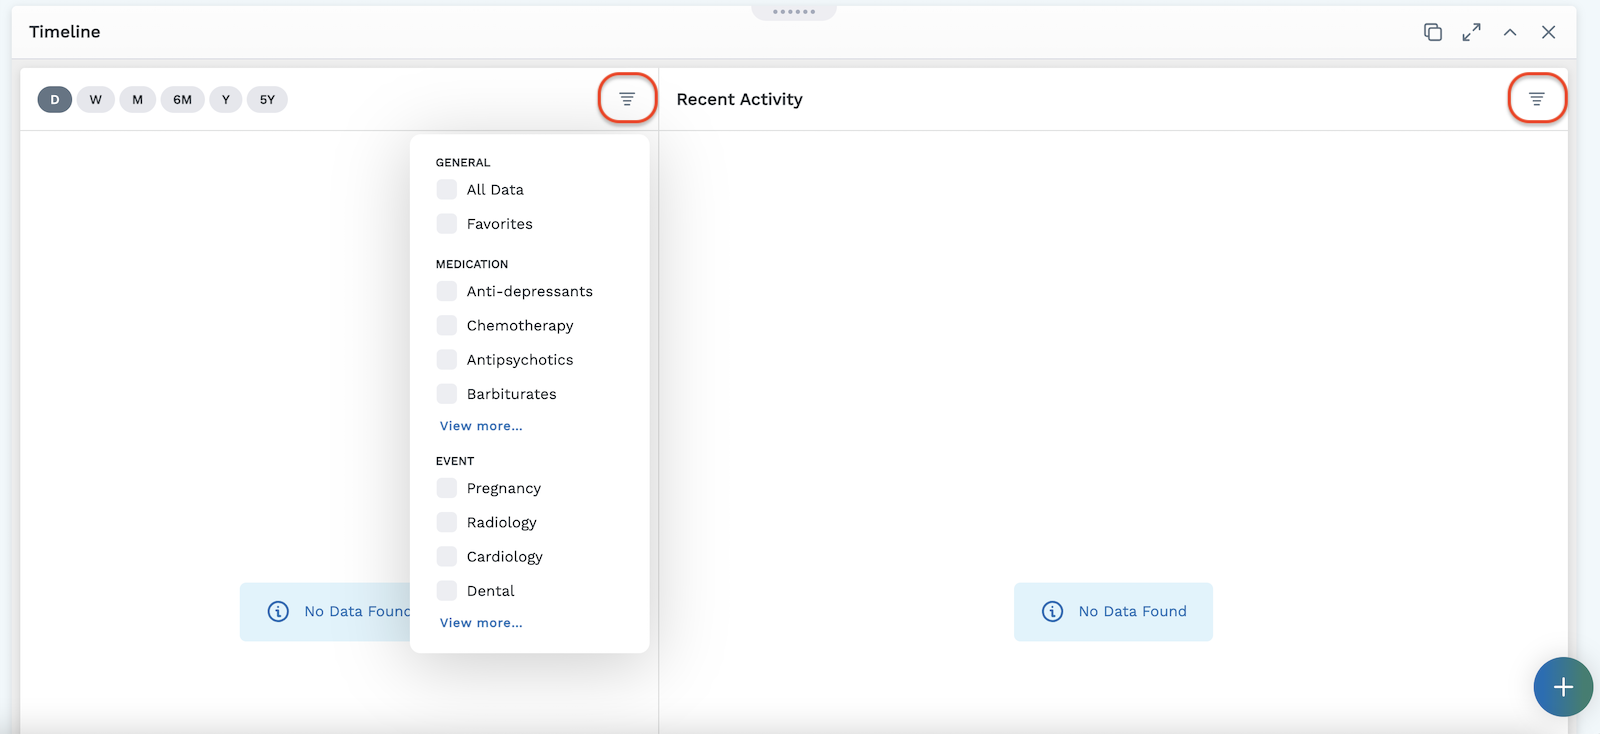
The module will appear in your Subject Viewer layout. "No Data Found" displays in both timeline sections until you filter and customize the data.
-
Click the filter button on the top right of the section on the left to begin customizing the timeline. Use the filter button on the top right of the section on the right to customize the Recent Activity section.
-
The filter expands to show the possible customization options. Filter by medications or events, and click "view more" to open additional filtering options. You also have the option to display "All Data" or only display data marked as "Favorites." See the section below on favoriting data to learn how to designate data as favorited.
-
Click the icon in the header to save your layout for future viewing. Your timeline filters will not be saved if you do not save the layout.
It is important to complete step 6. You must save the layout itself before you navigate away or all filtering data in the timeline will not be saved to the module.
Working with the Timeline
The timeline is interactive. Click the buttons in the top left to filter data based on a specific time window. Select the appropriate button to display data by:
- D = day
- W = week
- M = month
- 6M = 6 months
- Y = year
- 5Y = 5 years
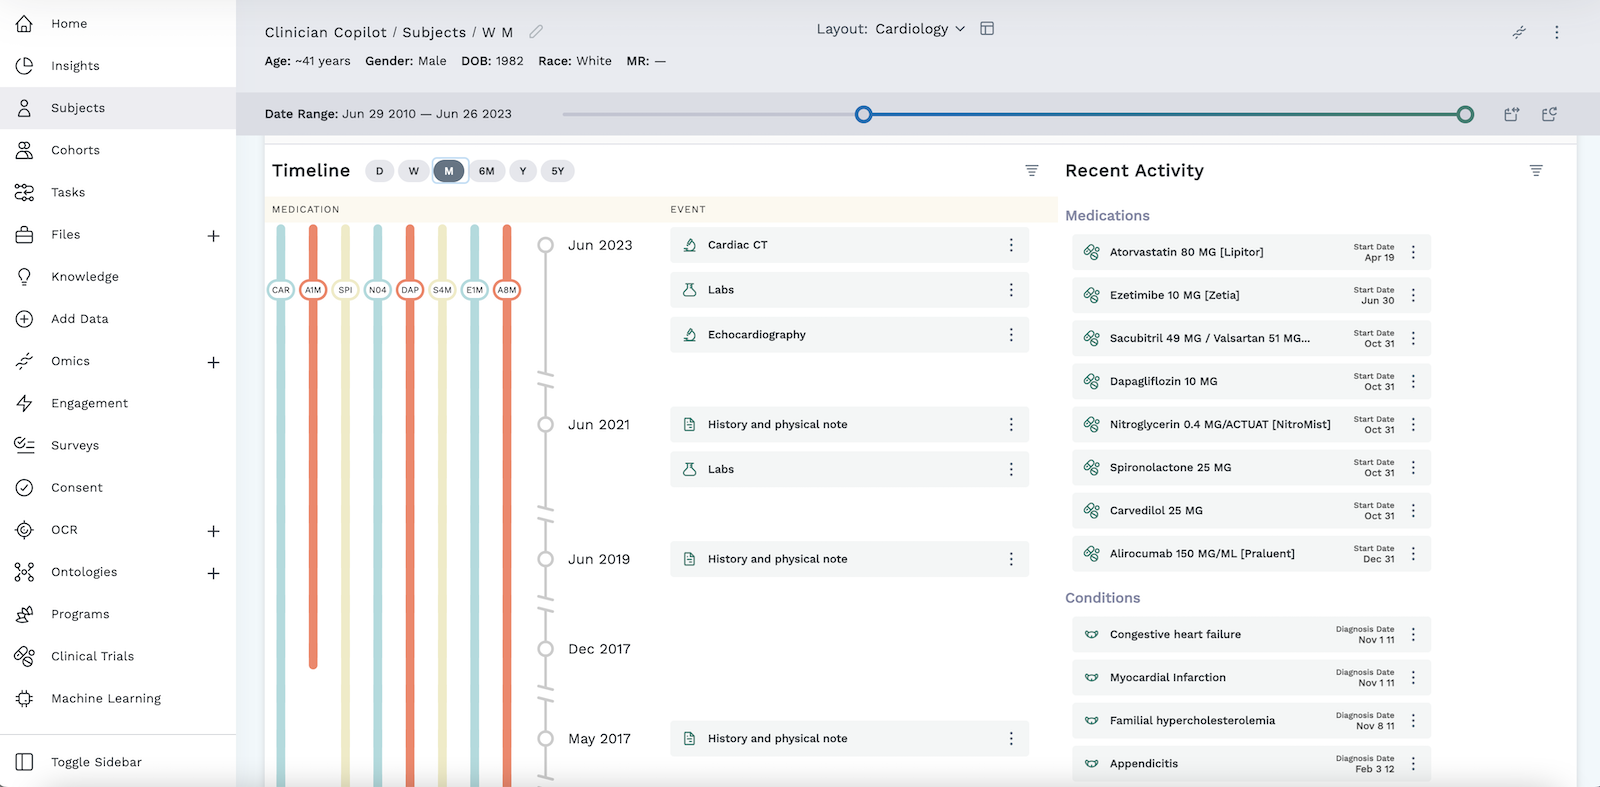
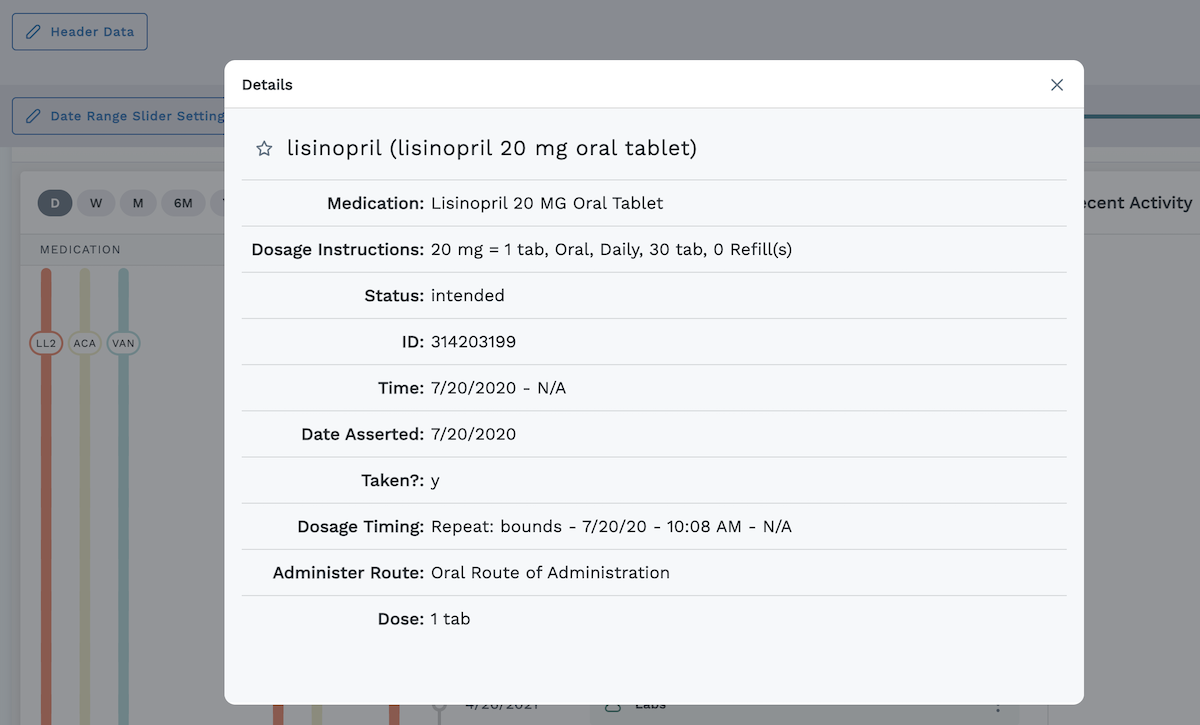
The left side of the timeline is divided into two parts: Medication and Event. Prescribed medications display as colored lines covering the dates of the prescriptions. The most recent dates are at the top. Hover on the circle with the abbreviation to expand the medication information and see the medication name and dosage.
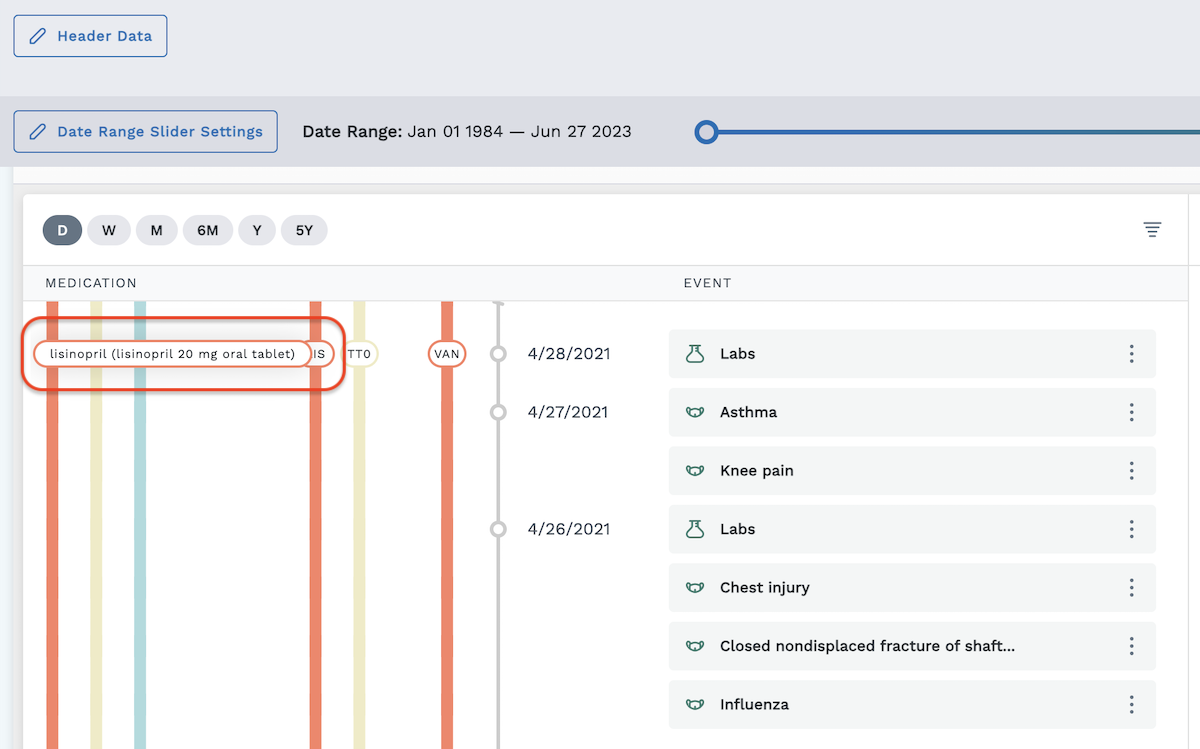
Click on the circle to open a box with even more detailed information.
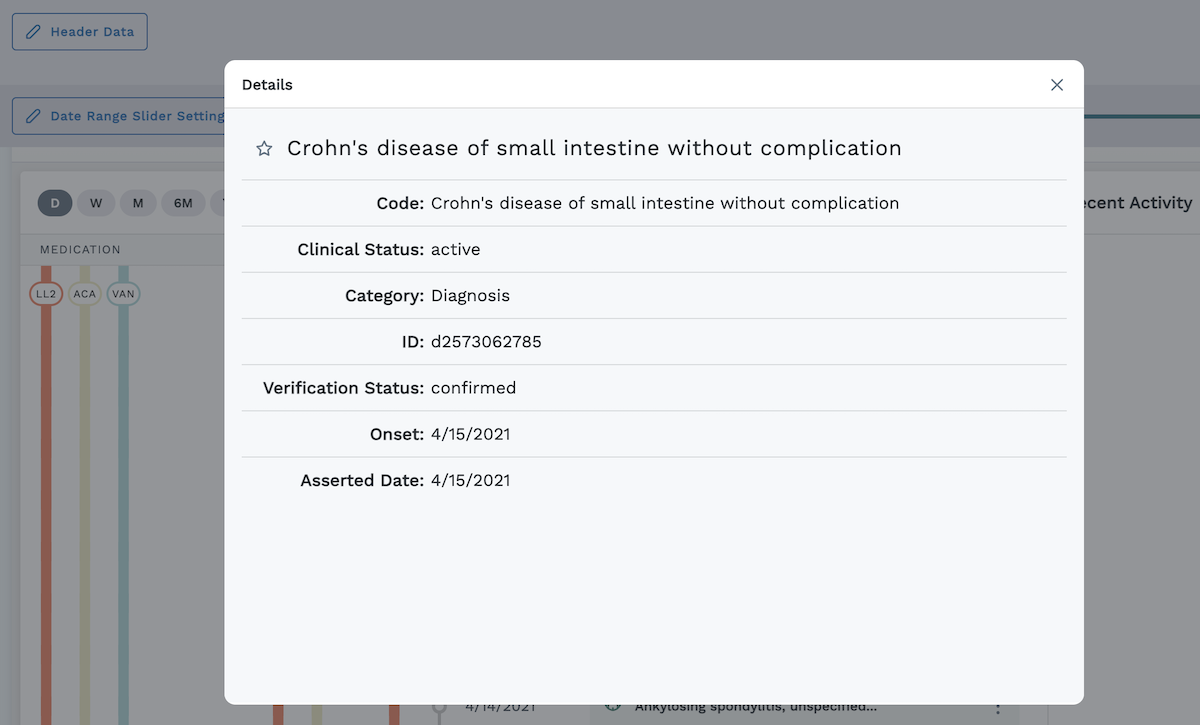
Under the Event section, click on the three dots next to the event to open a box with additional details, such as the example shown below.
The right section of the timeline is the Recent Activity section. It displays active medications and conditions or the most recent labs.
Remember to use the filter button on both sides of the timeline to determine which data to display in both the left side and the Recent Activity section.
Favoriting Data
You can favorite datapoints in graphs and tables. Mark favorite data with a yellow star to designate it as a favorite datapoint. This favorited data shows up on the timeline when the "Favorites" box is selected under the filter button.
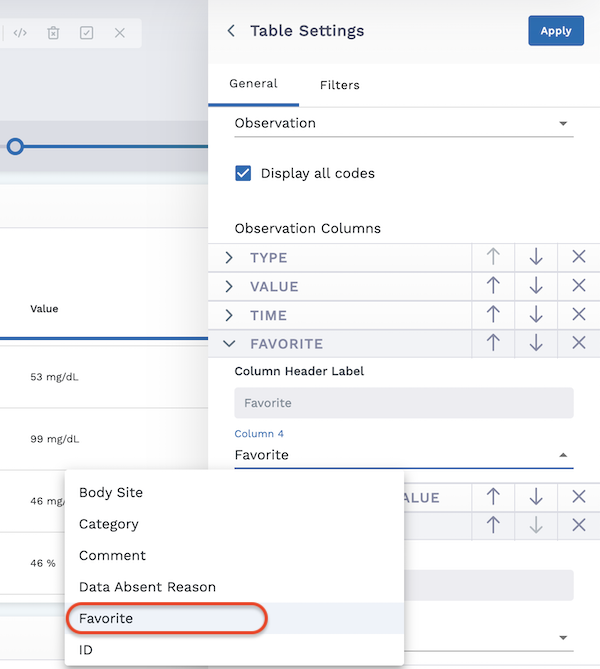
To select a favorite datapoint in a table, you must add a "Favorites" column in the table. To add the column, open the table module settings and create a column called Favorites. When configuring the column, use the dropdown to select "Favorites" to configure the column with the yellow star selection feature, as shown below.
This configures the table with a column with the yellow star selection feature, as shown below. Click the stars to turn them yellow and designate the datapoint as a favorite.

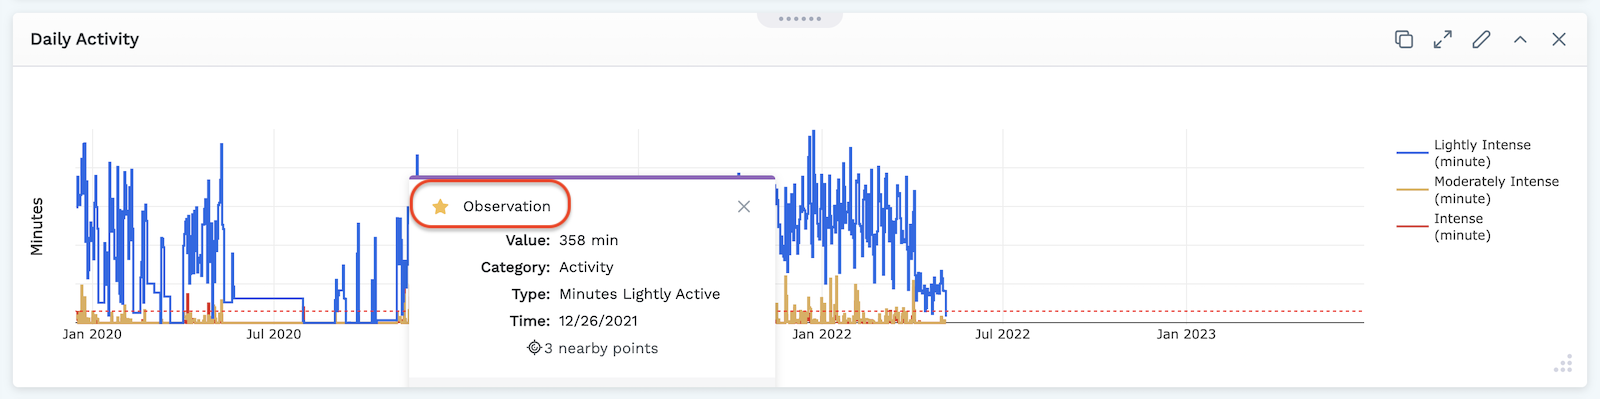
To select a favorite datapoint in a graph, you must enable the "detailed tooltip" feature. Visit the detailed section on using the detailed tooltip and follow the procedure to turn the feature on. Once enabled, you can click on the star shape of a favorite datapoint, turning the star yellow. This marks the datapoint as a favorite, as shown below.