Survival Curve
Module Settings
Title - Give a title for the survival curve module (for example, 5 year survival from Last Chemo)
Start - When do we want to start tracking whether or not people are dying?
-
Resource type: (such as Observations) Procedures, Observations, Medications, or Conditions
-
Either search for Resource Code - only one allowed (such as Chemo) or if resource type selected was Conditions, you can toggle on the Select from Project Tags to select the tag
-
Reference to Resource - Select from:
- After First Occurrence (an example of this is when people started Chemo)
- After Last Occurrence
Death/Event
- Resource Type - (such as Date of Death) Medications, Procedures, Conditions, or Observations
Censoring
- Censor Method - Select from:
- None
- Last known follow-up
- Use Interval Time (assume people survive)
- Specific Event - Then specify Resource Type (Medications, Procedures, Observations, or Conditions), then specify resource code in the search box (if conditions had been selected for resource type, you can toggle on the "Select from Project Tags" and choose the Project Tag from the dropdown menu.
Reference to Resource - First occurrence or last occurrence
Duration of Analysis - (such as 60 months) Select the number and time interval - days, weeks, months, or years.
Cohort Comparision - Select up to four cohorts to compare (if cohorts have been created for the project). The bars of your chart split to represent the different cohorts in the given module.
- Click Preview at the top of the module settings to view it.
- If everything looks good, click Apply to apply the new settings. This will NOT save the module. If you click away, you will lose this module.
- To save this module and its settings to the layout, click the Save Changes icon found in the header at the top of the page. Or if you need to make changes, click the Edit icon in the top right corner of the module.
Clicking Apply will create your chart. It does not save the layout. To save the layout, you must click the Save Changes icon (found in the header). Navigating away from this page before clicking the icon will cause you to lose all changes since your last save.
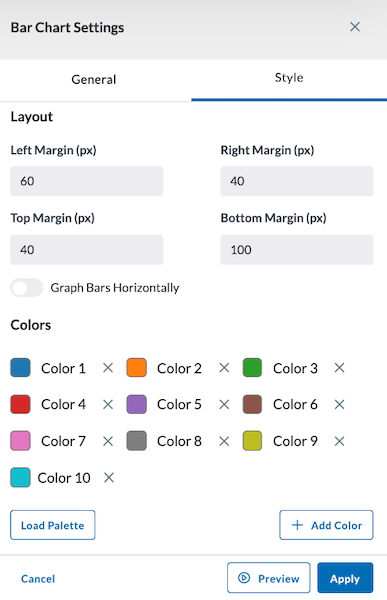
Style
The Style tab allows you to adjust the colors of your bar chart and select the margin size of your module. You can also load a palette for more color options.
Preview, Apply, and Save your new settings:
- Click Preview in the module settings to view it.
- If everything looks good, click Apply to apply the new settings. This will NOT save the module. If you click away, you will lose this module.
- To save this module and its settings to the layout, click the Save Changes icon found in the header at the top of the page. Or if you need to make changes, click the Edit icon in the top right corner of the module.
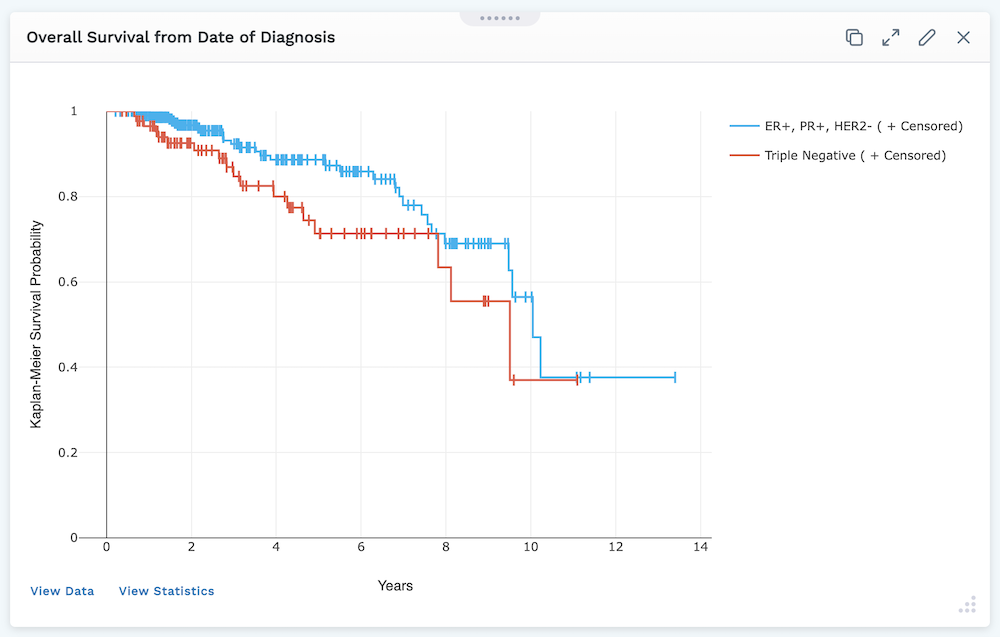
Viewing your Survival Curve
The display always starts at 100%. Each stair step down represents someone's death.
If you hover your cursor in the top right of the module, the Plotly Mode Bar presents you with tools to help you view the Survival Curve.
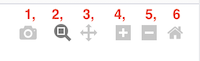
The Mode Bar tools shown above include:
- Download plot as a PNG
- Zoom - Zooming can be performed vertically and horizontally. If graphs are stacked, only the one you zoomed in will change. When graphs are layered, all will zoom in. Double clicking within the part you zoomed will reset the vertical
- Pan - lets you grab and drag the plot to change the date range seen
- Zoom in - lets you zoom in
- Zoom out - lets you zoom out
- Reset axes - lets up zoom to include your Axes Range, if this has been set. If it has not been set it zooms to a setting that shows all the viewable data.
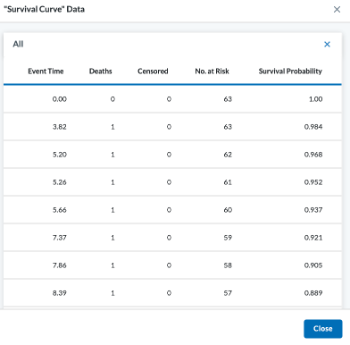
Beneath the Survival Curve graph are two buttons:
-
View Data - Shows Event Time, Deaths, Censored, No. at Risk, and Survival Probability for each Cohort
-
View Statistics - Shows statistics on the data plotted
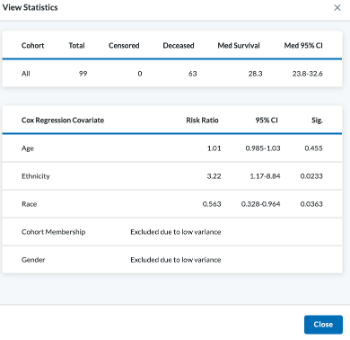
The data displayed depends on the comparison you run. Options include:
-
Cohort
- Total
- Censored
- Deceased
- Median Survival
- Median 95% Confidence Interval
-
Test
- Chi-Square
- Degrees of Freedom
- Significance
-
Cox Regression Covariates
- Risk Ratio
- 95% Confidence Interval
- Significance