Oncoprint
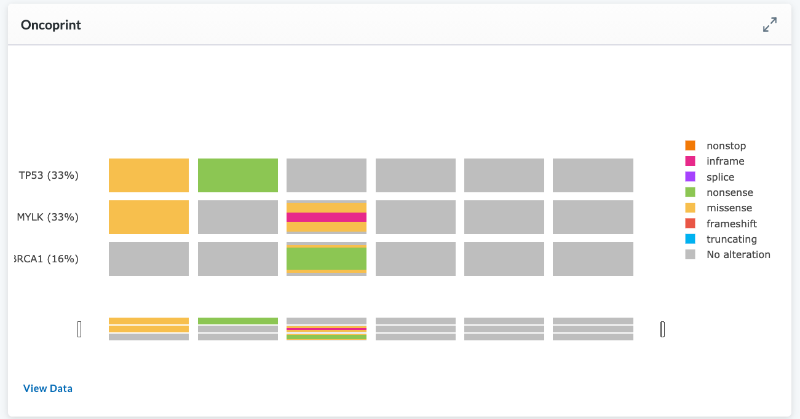
Oncoprint allows users to visualize gene mutations.
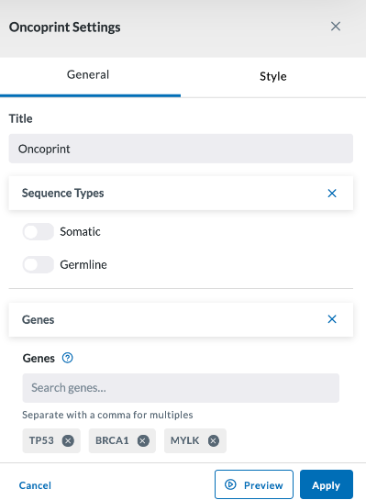
Users selecting the Oncoprint module to add to their layouts will be presented with a settings screen to specify what is displayed.
The above image was built using data stored in the LifeOmic Platform for this project and the settings specified below.
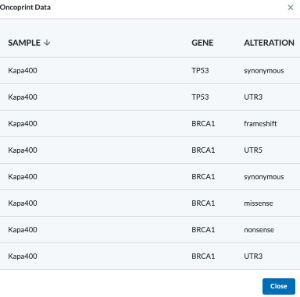
The Oncoprint module includes a View Data button on the lower right. Clicking this opens a pop-up with the data displayed in the Oncoprint.
General
Title - Give your Oncoprint module a name. This will be displayed at the top right of the module.
Sequence Types You toggle on the Somatic and/or Germline switches, or you can leave both off.
Genes Select which Genes you wish to add to the display. You can add more by clicking the Add Gene button or remove a gene by clicking the X beside the selected gene.
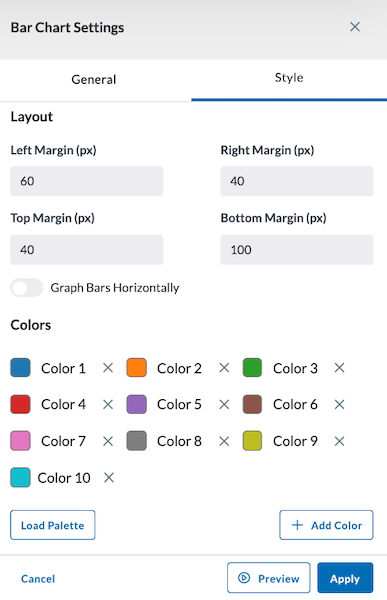
Style
The Style tab allows you to adjust the colors of your bar chart and select the margin size of your module. You can also load a palette for more color options.
Preview, Apply, and Save your new settings:
- Click Preview in the module settings to view it.
- If everything looks good, click Apply to apply the new settings. This will NOT save the module. If you click away, you will lose this module.
- To save this module and its settings to the layout, click the Save Changes icon found in the header at the top of the page. Or if you need to make changes, click the Edit icon in the top right corner of the module.
Clicking Apply will create your chart. It does not save the layout. To save the layout, you must click the Save Changes icon (found in the header). Navigating away from this page before clicking the icon will cause you to lose all changes since your last save.