Heatmap
Users adding the Heatmap module to their layouts can adjust the settings in the General tab (shown below) to specify what is mapped. They can also give the Heatmap a name (title) to be displayed at the top of the module.
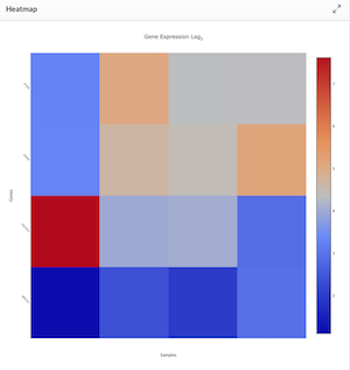
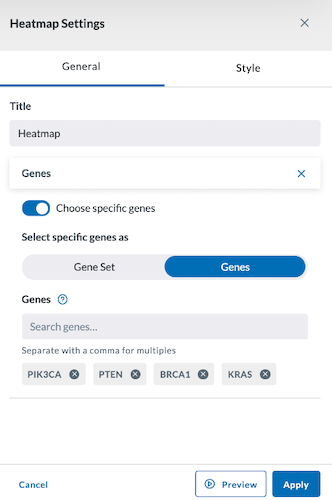
The settings in the image below helped build the heatmap shown above and was created with the settings toggled to graph specified Genes (separate multiple genes by a comma in the search box).
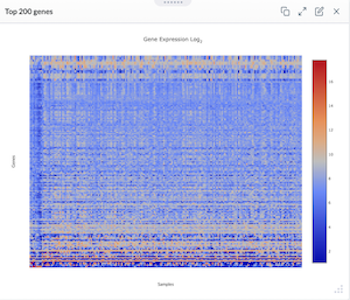
If Gene Set is toggled on, it will create a map that looks similar to the image below.
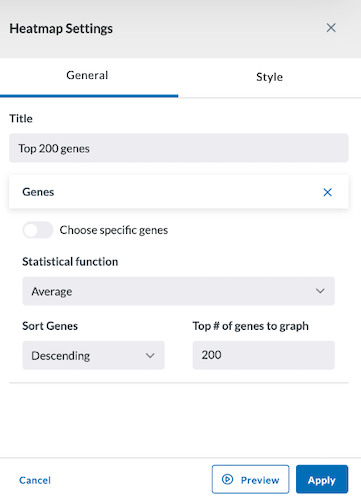
The settings used to build the heatmap above are shown in the image below.
Style
The Style tab allows you to adjust the margins of your module.
Preview, Apply, and Save your new settings:
- Click Preview in the module settings to view it.
- If everything looks good, click Apply to apply the new settings. This will NOT save the module. If you click away, you will lose this module.
- To save this module and its settings to the layout, click the Save Changes icon found in the header at the top of the page. Or if you need to make changes, click the Edit icon in the top right corner of the module.
Clicking Apply will create your chart. It does not save the layout. To save the layout, you must click the Save Changes icon (found in the header). Navigating away from this page before clicking the icon will cause you to lose all changes since your last save.