Modules
Modules are the graphs/charts that make up a layout. You can customize each module, determining what data is shown, what subject populations to compare, and what module type you'll use to visualize your data. By default, all subjects will be displayed in the modules in your layout. You can also choose to see the graphs reflect data from a selection of subjects, or a cohort.
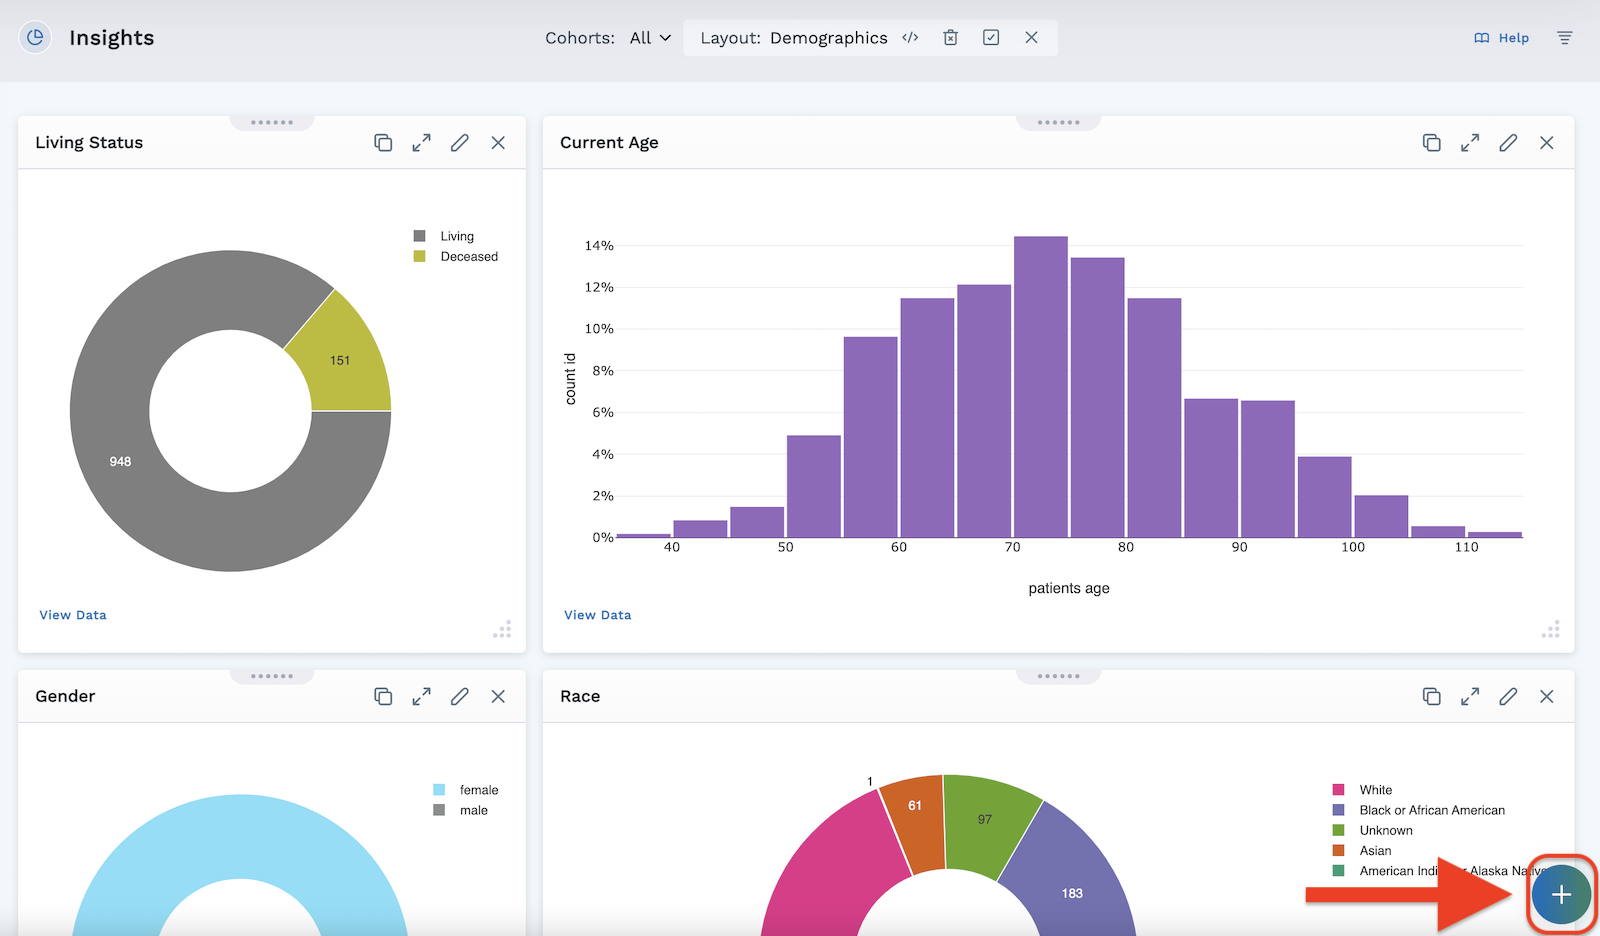
Clicking the Edit Layout icon in the header allows you access to the round Add Module button at the bottom right of the screen.
There is no limit to how many modules you can have in a layout, though some graphs take more time to load.
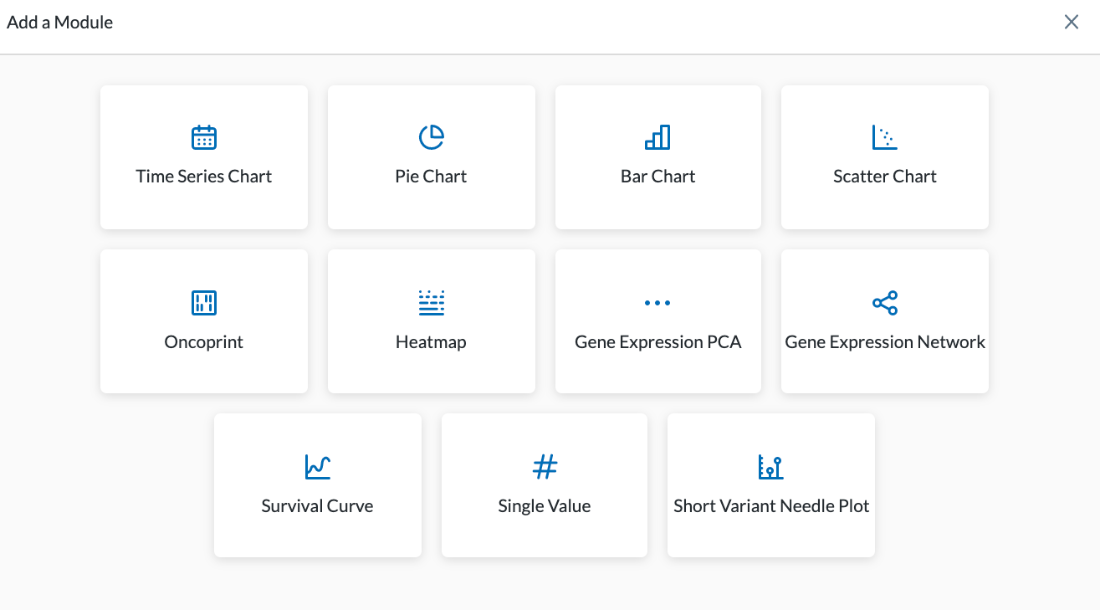
The types of modules available for your dashboard include:
- Pie Chart
- Bar Chart
- Scatter Chart
- Time Series Chart
- Single Value
- Oncoprint (visualize gene mutations)
- Heatmap (gene expression heat map)
- Gene Expression PCA (gene expression PCA plot)
- Gene Expression Network (gene expression network plot)
- Survival Curve
- Short Variant Needle Plot
It is important to note that your data will not automatically save. It is good practice to save your work often by clicking the Save Changes icon , found in the header in the Edit Layout toolbar.
Module Tools
While in Edit Layout mode, you can access tools and handles that will allow you to adjust each module. These tools include the ability to:
- Copy the module to the current layout or to a different layout
- Show the module in full screen
- Edit the module parameters
- Remove the module
- Move where the module is located in the layout
- Resize the module
Move a Module
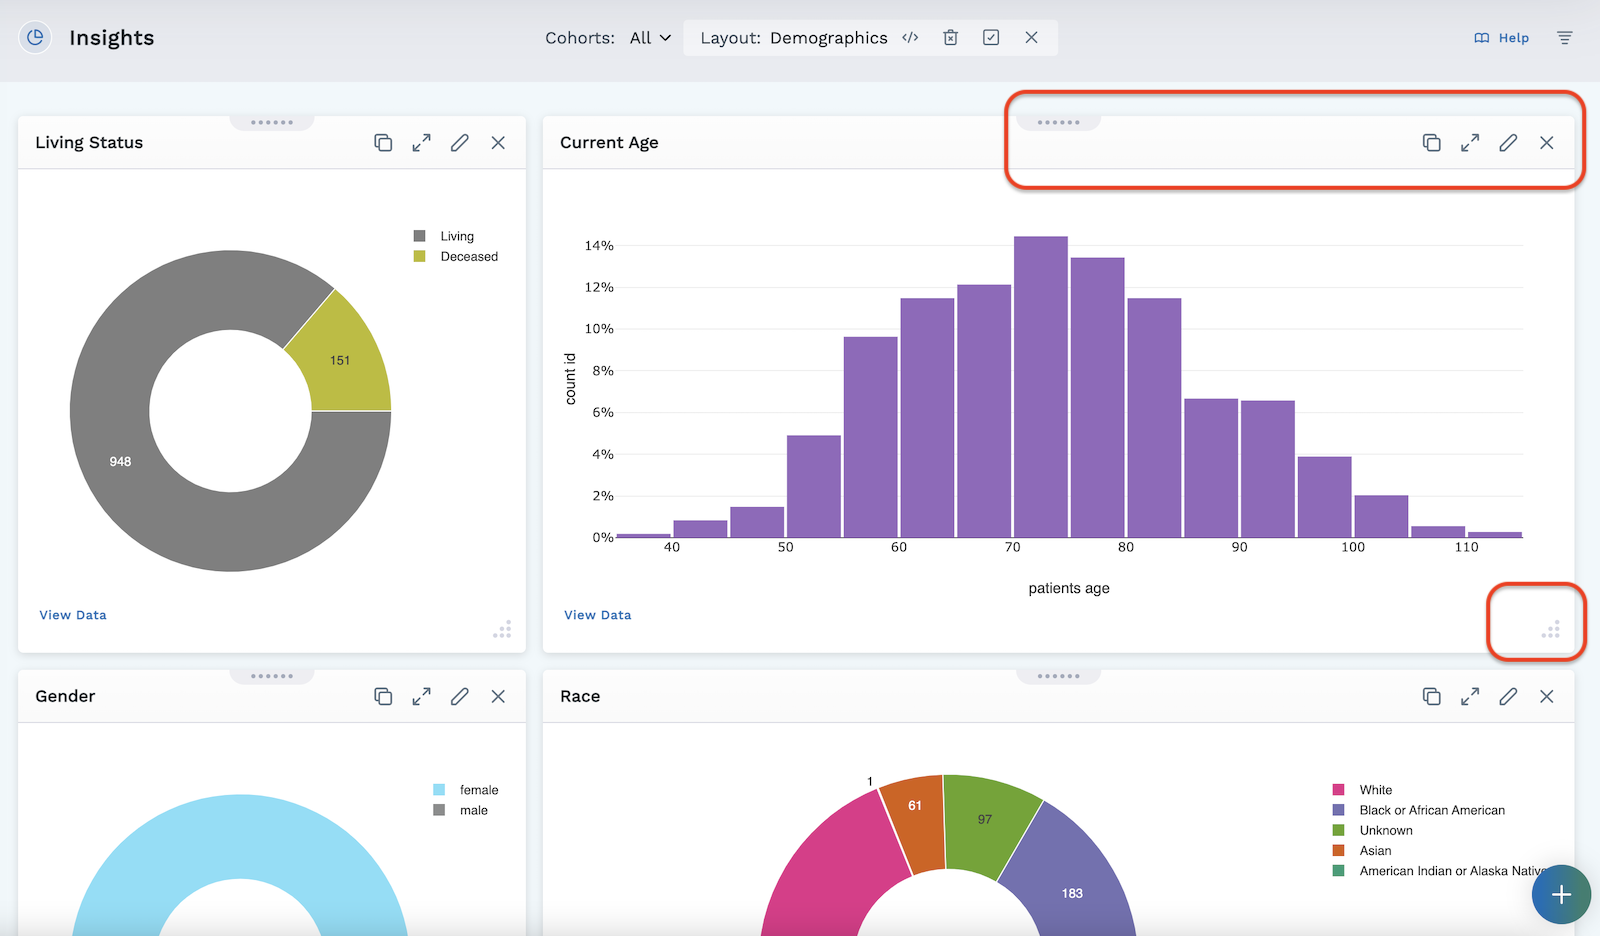
Each module has a series of dots at the top that acts as a handle.
- Go into Edit Layout mode by clicking the Edit Layout icon in the header.
- Click and hold the handle to drag and drop your module anywhere in your layout.
- Click Save Changes icon in the header to save your changes.
Resize a Module
Each module has a resizing handle (a triangle of dots) in the bottom right corner, allowing you to adjust the size of your module.
- Be sure you are in Edit Layout mode by clicking the Edit Layout icon in the header.
- Click and hold the resizing handle as you stretch or shrink the module to the desired size.
- Click Save Changes icon in the header to save your changes.
Module Tools
When in Edit Layout mode (by clicking the Edit Layout icon in the header), you can see four tools at the top of each module.
These tools include:
- Copy will copy the layout to:
- the current layout (you can then modify module settings if you wish).
- a different layout (if this is selected the current layout will be saved) - clicking this opens a dropdown menu where you can select which layout within your project you wish to copy the module to. Click Accept. A copy of that module has now been placed in the designated layout.
- Open module in a full screen window (once open, click the "x" to exit the view).
- Edit - Allows you to perform edits on the existing module:
- In the module you wish to edit, click the Edit Module icon in the top right corner of the module.
- Adjust the module settings in the window that opens (options available vary based on module).
- Click Preview at the bottom of the module settings window to open a preview window.
- If everything looks correct, click Apply to build your chart in the layout.
- Click the save changes icon in the header to save your changes.
- Delete module:
- Click the in the top right corner of the module you want to remove.
- Click save changes icon in the header to save your changes.
Graph Viewing Tools
Each Graph has an icon at the top right of the module allowing you to make the graph full screen.
Plotly graphs in the LifeOmic Platform have a mode bar of tools to improve the ease of viewing the displayed data (shown below).
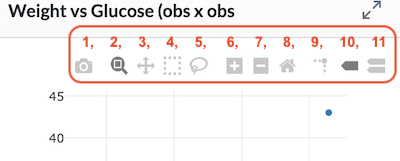
Mode bar graph tools include (numbers reference the icons in above image):
- Download plot as a PNG
- Zoom - Zooming can be performed vertically and horizontally. If graphs are stacked, only the one you zoomed in will change. When graphs are layered, all will zoom in. Double clicking within the part you zoomed will reset the vertical
- Pan - lets you grab and drag the plot to change the date range seen
- Box Select - allows you to select multiple points
- Click and drag your cursor to select your data points within the box
- Click View Data - a window opens with info for the selected data points.
- Lasso Select - allows you to select multiple points
- Click and drag your cursor to select your data points within the box
- Click View Data - a window opens with info for the selected data points.
- Zoom in - lets you zoom in
- Zoom out - lets you zoom out
- Reset axes - lets up zoom to include your Axes Range, if this has been set. If it has not been set it zooms to a setting that shows all the viewable data.
- Toggle spike lines – when you hover, this drops a dotted line to the x and y axis to see where it lands
- Show closest data on hover – shows the one data point you are closest to
- Compare data on hover – shows all data points when you hover, if you toggle that off you’ll see the single data point that you are closest to
View Data
On each of the graphs, you can click the View Data button in the bottom left of the module. This opens a new window displaying the data in table form. The columns of data displayed can be selected on the subject search table configuration page.
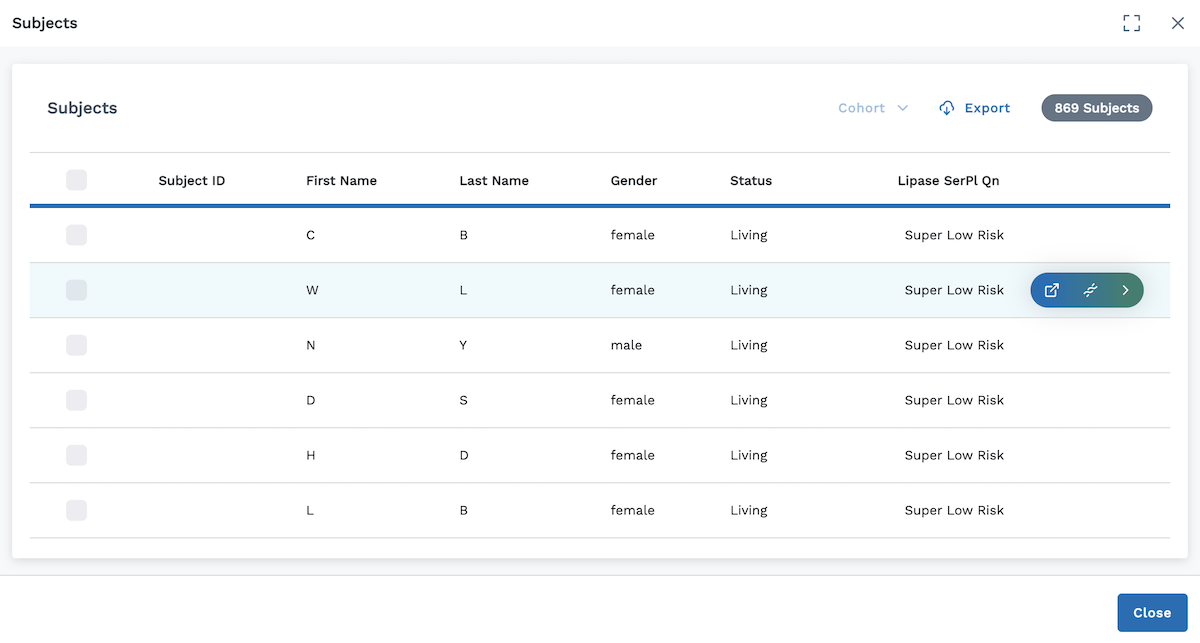 Here you can:
-
Open this window in full screen by clicking
-
Access Cohort actions using all or a selection of the subjects viewed:
- Select Subjects you wish to add to or remove from the cohort
- Click on the Cohort dropdown button on the top right of the table
- Select from:
- Create Cohort (makes a new cohort)
- Add to a Cohort (adds to an existing cohort)
- Remove from a Cohort (removes the selected subjects from a cohort)
- Continue selecting the parameters for your action
- Click Update or Create depending on the action chosen
-
Export the data displayed (clicking Export opens a new window where you can select masked or unmasked data export)
-
Access other tabs of the LifeOmic Platform - hover cursor on a line to access:
- Opens Subject Viewer for this subject in a new tab
- Opens Omics Explorer for this subject in current tab
- Opens Subject Viewer in current tab to view more details
Module Parameters
Module parameters available differ depending on which module is selected and what is being graphed.
Modules have a default label that is assigned to the x and y axis, but are often not very descriptive. These labels can be customized to better describe what is displayed in the chart.
Customize x and y labels:
- Go into Edit Layout mode by clicking the Edit Layout icon in the header.
- Click the Edit icon in the top right corner of the module.
- Under the General tab of the module, navigate to the X and/or Y axis values.
- Add the text for the label you wish to be displayed for that axis.
- Click Apply to build your chart in the layout.
- When you are satisfied with your chart, click the Save Changes icon in the header to save your changes.
If you remove the label, it will revert back to the default label.
Remove Module
To remove a module from your layout:
- Be sure you are in Edit Layout mode by clicking the Edit Layout icon in the header.
- Click the in the top right corner of the module you want to remove.
- Click Save Changes icon in the header to save your changes.