Manage Surveys
You can view and analyze survey metrics and responses on the Manage Survey page. On the main surveys page, click anywhere on a survey row to access this section.
Survey Metrics

Toggle between Survey Metrics and Responses for more data on your survey. Survey Metrics shows two sections: Response Completion and In-Progress Dropoff.
Response Completion
The Responses tab shows your survey questions and results over time displayed as Totals or Trends. Totals show all the responses to the survey question, where Trends map out the responses over time.
Select the Total button to use the Response Completion section to view the number of survey responses completed in a bar chart. Select Trend to see exactly when the survey responses were completed over time. You can change the interval to display the data hourly, daily, weekly, monthly, or yearly.
In-Progress Dropoff
Use this section to help understand the point in the survey in which respondents stop completing it. This can help pinpoint the survey questions that are causing participants to abandon the survey. Select Total to view the data in a bar chart showing the last completed page, and select Trend to see the completion percentage by the participants in graph form.
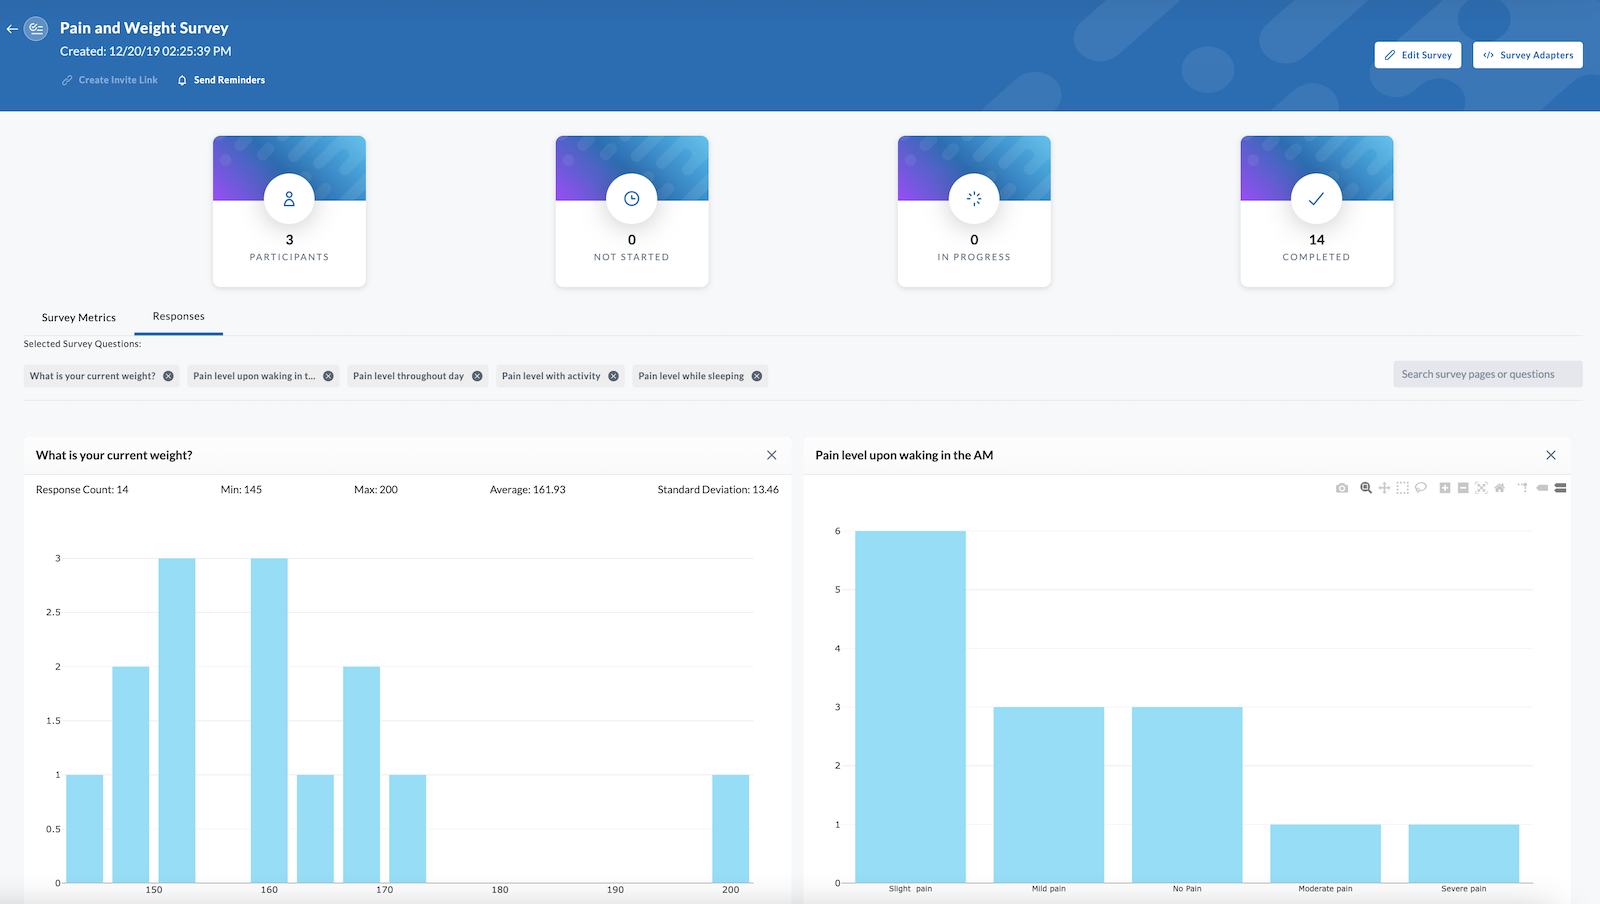
Responses
Click on the Responses button to see a graphical representation of the responses to each survey question. To optimize screen loading time, only the first 16 questions are rendered on the Responses page. For longer surveys, you can select which response renderings are displayed.
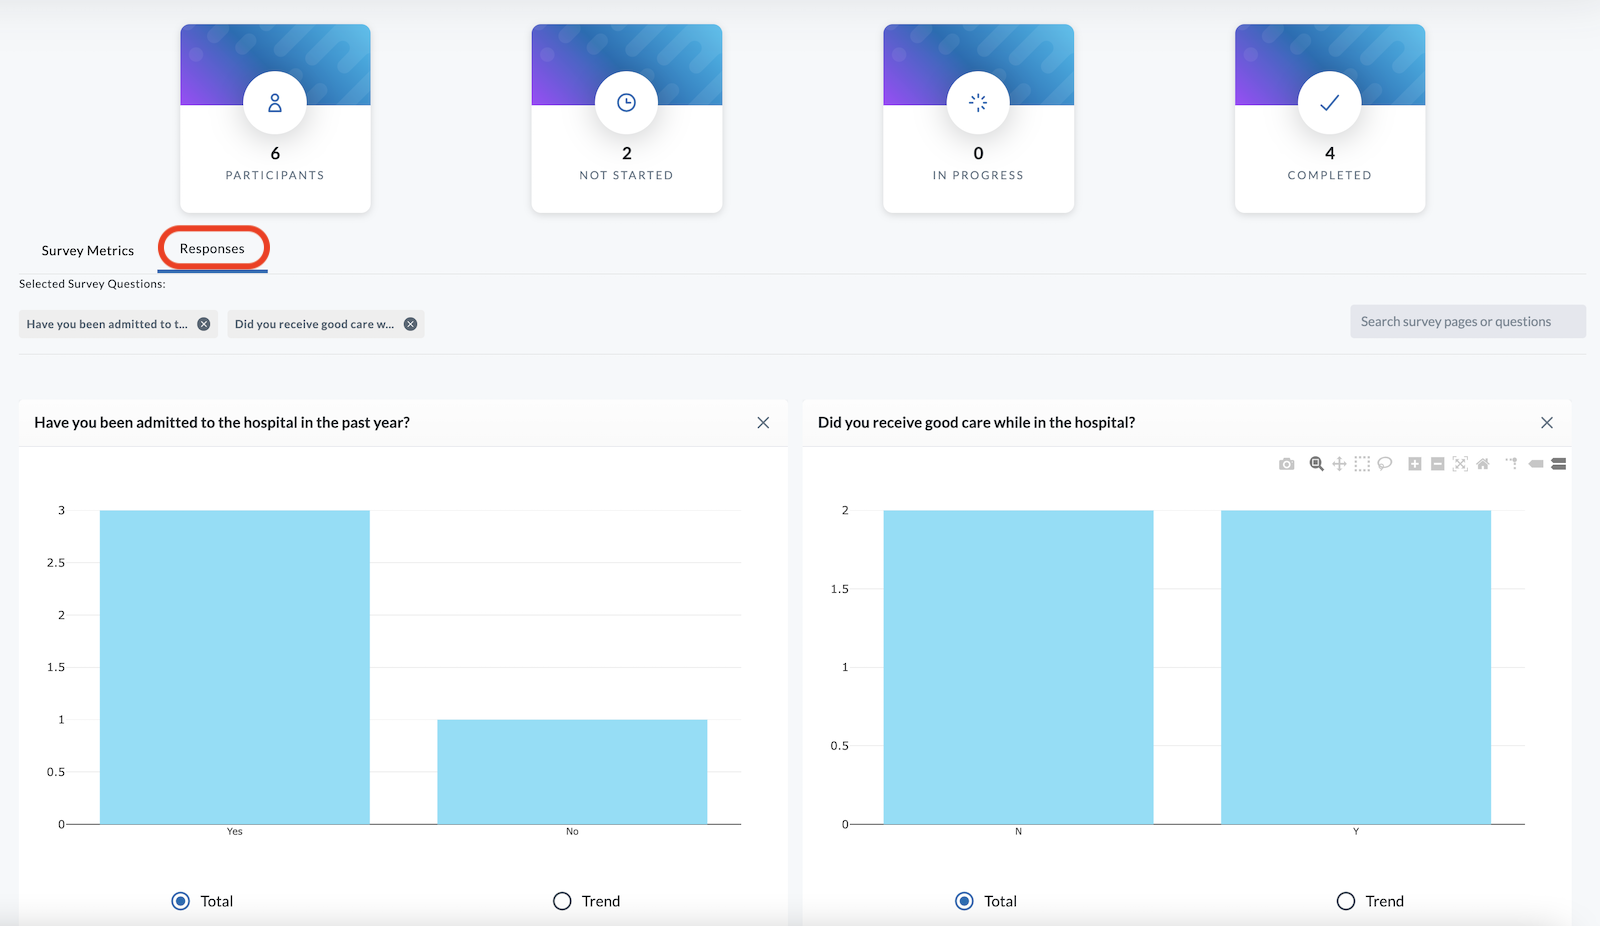
- To remove a response rendering, click the "x" in the top right corner of the question.
- To add a response rendering, click on the "search survey pages or questions" bar at the top right of the screen. Then scroll through a full list of your survey questions or type in a keyword to locate the question response you want displayed.
Totals vs. Trends
The survey results page for numerical responses can be rendered as Totals or Trends. Selecting the corresponding button beneath the rendering will switch between these views.
-
Total button - Total shows renderings of all the responses collected for that question.
-
Trend button - Trend shows renderings of data collected over time. Clicking this button opens a set of additional buttons allowing you to aggregate the data based on hourly, daily, weekly, monthly, or yearly reporting.
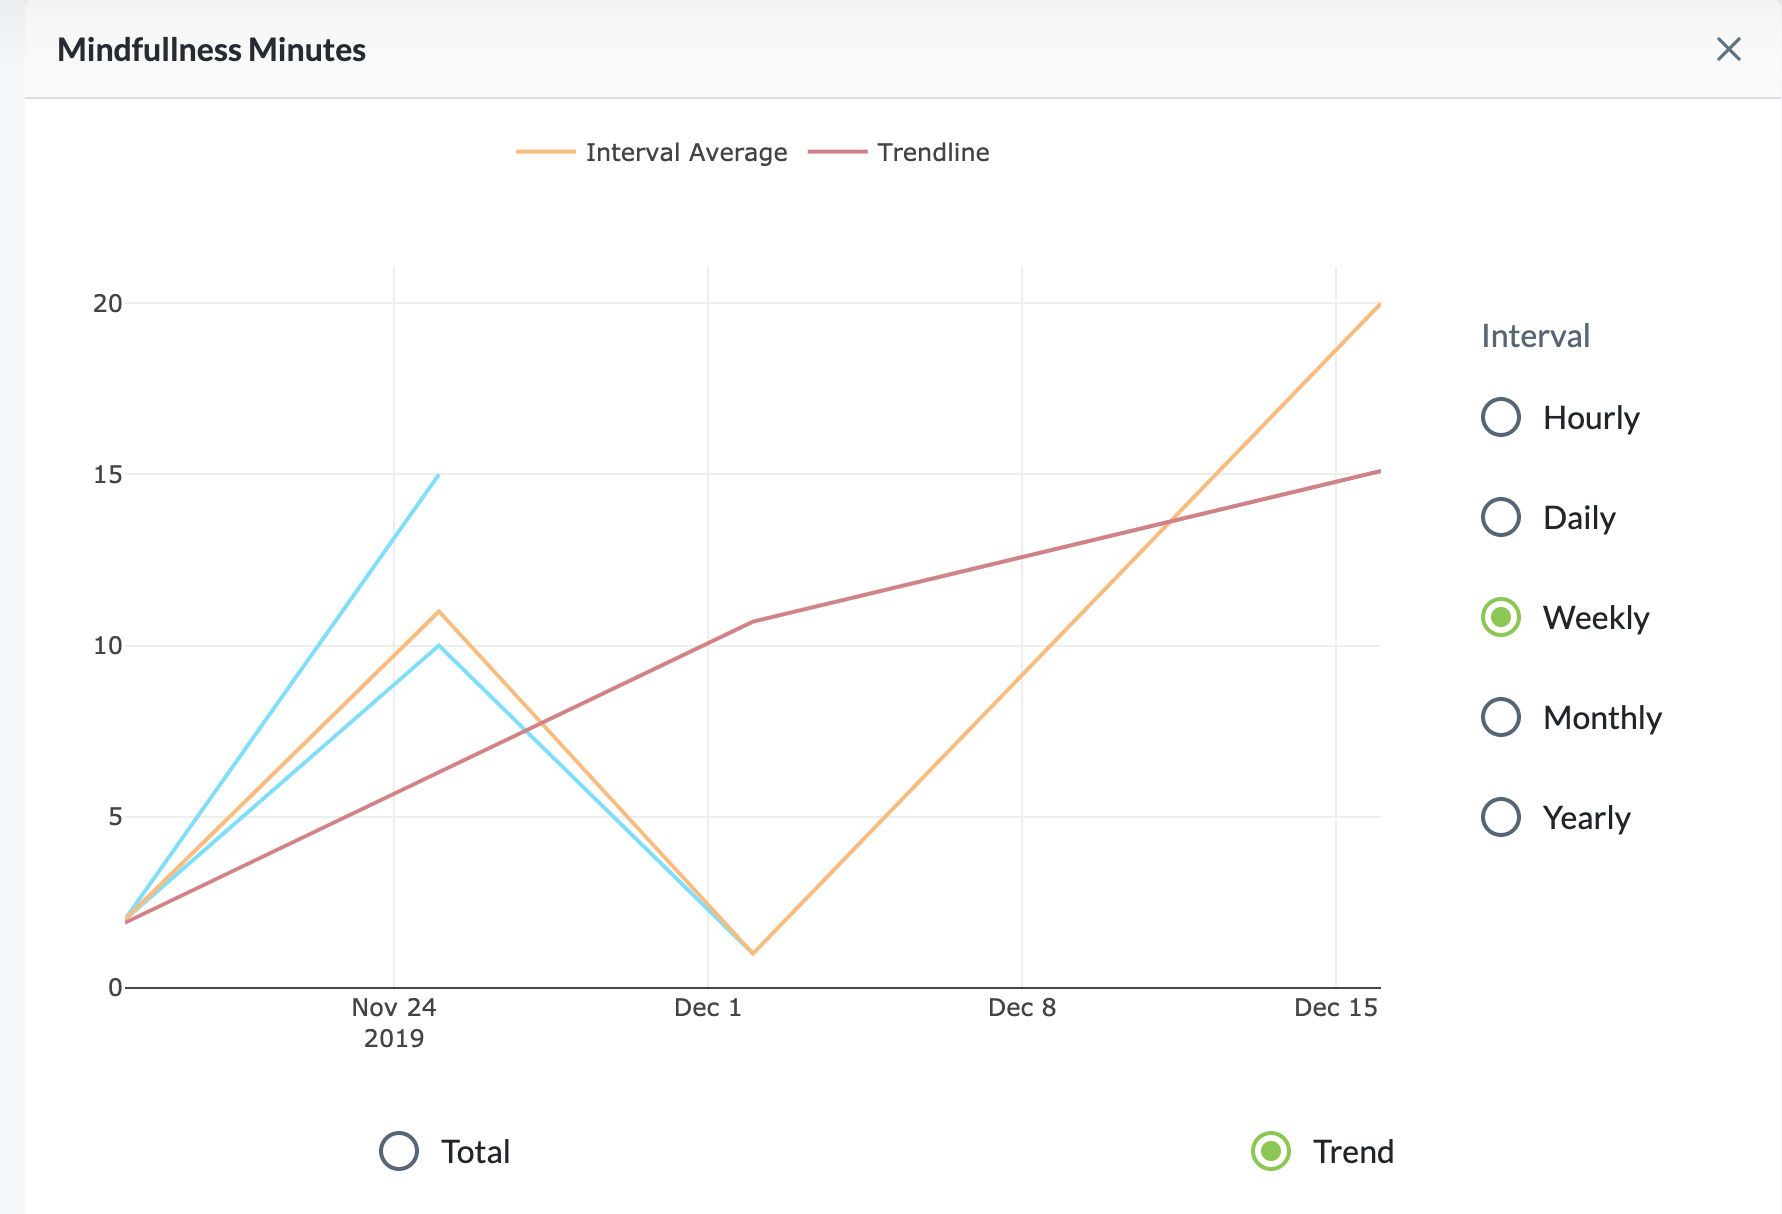
In this rendering, the orange line represents the daily average, the red line shows the overall trend, and each person’s response is indicated with blue lines.
Trends help you monitor the progress of the subject population. For instance, if you are managing a weight loss program and want to see if you've had success, you can view the trend of subjects reported weights over time and see if the overall trend shows a loss or a gain.
Response, Word, and Word Cloud
The survey results page for single textbox questions with open-ended text entry responses (such as "What is your mailing address?") offer the following rendering options:
- Response button - Response is a list of all responses to that question.
- Word button - Word graphs the frequency of each word/number used in the response.
- Word Cloud button - Word Cloud creates a cloud-like image from the responses provided.
Send Reminders
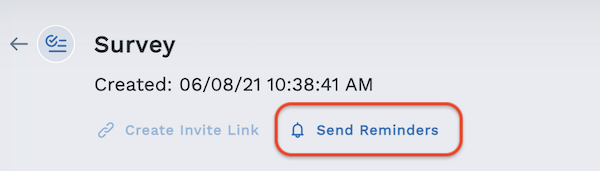
From the top left of the Manage Survey page, click Send Reminders to send a reminder to assigned subjects who have not completed the survey. A reminder may be sent as soon as seven days from the initial invite, and reminders are emailed a maximum of once a week.