Omics Explorer View
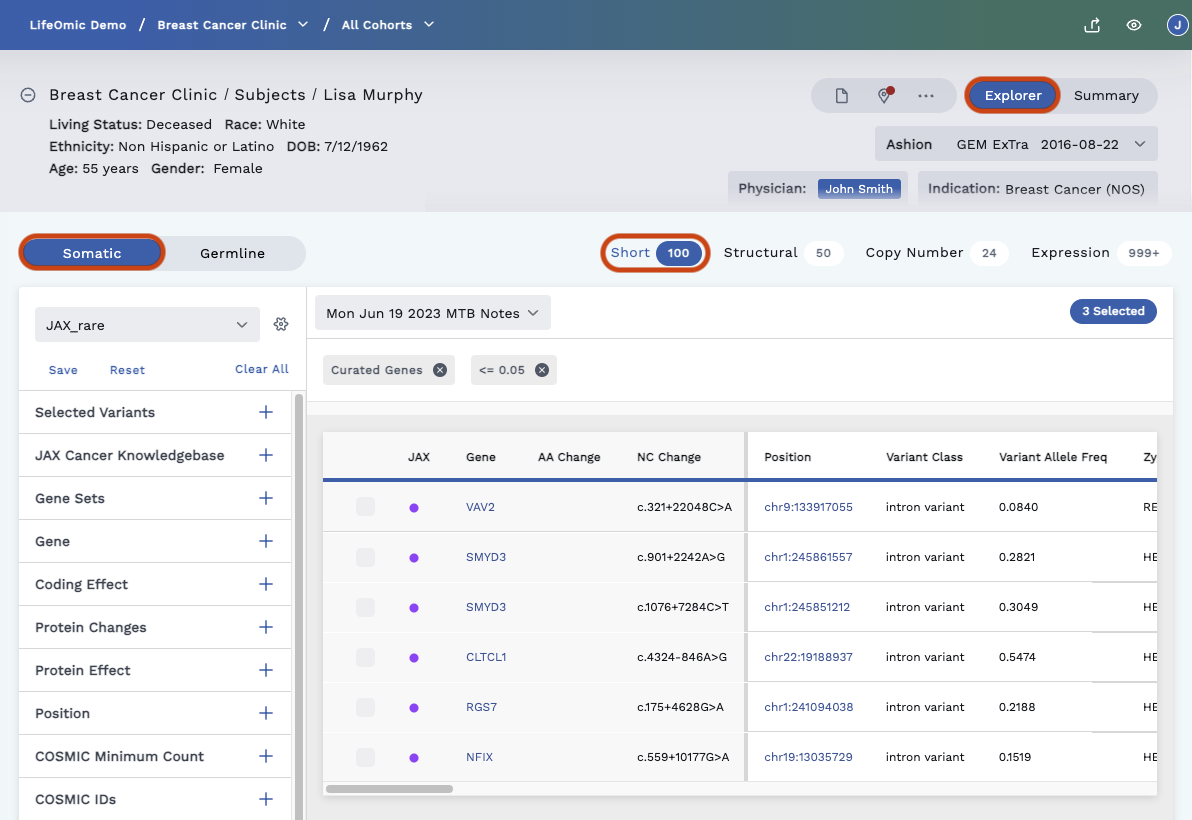
On the top right of the Omics Explorer page, click the Explorer button for a filtered view of the omics data. The filtered view breaks the Somatic and Germline Variants data into their own tabs. Users use the filters on the left side of the page to define the data displayed in the Omics Explorer table.
Somatic Variant vs Germline Variant
Somatic and Germline Variants are often referred to as sequence types.
-
Somatic Variant – A somatic mutation is a variant that is added later (such as a cancer from smoking). Somatic mutations occur in a single body cell and cannot be inherited. The tumor RNA and DNA are sequenced from a tumor sample.
-
Germline Variant – A germline mutation (such as a BRCA mutation) comes from the germ cells (egg and sperm) and is found in every cell of the body. This mutation can be passed down to offspring. This DNA is sequenced from blood or saliva.
Variant Types
Within the Somatic and Germline tabs, you can view the variant types within those sequence types.
Select from the following:
- Short A single nucleotide variant or short insertions and deletions in the DNA such as ~ 1-20 base changes. This option has the most annotations and the most filters.
- Structural (for example, fusions, translocations and inversions) There are fewer data columns associated with Structural Variants. Also, there will often be two genes listed together under the Gene column.
- Copy Number (duplications or deletions of a large region)
- Expression (RNA sequencing) This variant looks at close to 20,000 genes in the genome. It shows expression for all of those - which is too many to scroll through. You can click the carrot to change the sort order of the column (ascending/descending). But this sort order is not for the full 20,000 genes, it is only for what has been loaded into the table at that moment in time.
Use the Expression Rank Order filter to perform the ascending/descending listing of Expression across all 20,000 genes. It is not limited to the genes in the table. Select either:
- Order by highest expressed
- Order by lowest expressed
Filters
The available filters vary depending on which Variant Type is selected. Selected filters only apply to the sequence type and the variant type (such as filtering on the Somatic Short Variants). Filters search across all transcripts, not just the canonical transcript.
If no filters are selected, the Omics Explorer Table shows all variants within the specific test. This includes (Germline vs Somatic) and Variant Type (short, structural, copy number, expression).
Once you add a filter, a chip with the filter name gets added above the Omics Explorer Table. You can remove the filter by deselecting it in the filter list on the left of the page or clicking the “x” on the filter chip. You can also clear all the filters selected with the Clear All button at the top of the filters panel.
Filter selections within a category are “ORed”. For example, under the Coding Effect filter category, selecting Frameshift and Splice region will return results that match Frameshift OR Splice Region.
Filter selections across categories are “ANDed." In the example below, two filters are selected from different categories. By adding a Missense filter from the Coding Effect category and then adding a Heterozygous filter from the Zygosity category, the filtered results shown in the table will match both the Missense Coding Effect filter AND the Heterozygous Zygosity filter.
Saved Filters
Creating saved filters requires the Administration>Account (ABAC Layout Admin) permission. To grant privileges, see Access Control.
Saved Filters let users access complex filtering criteria with a dropdown menu. This dropdown menu can be found on the left side of the Omics Explorer.
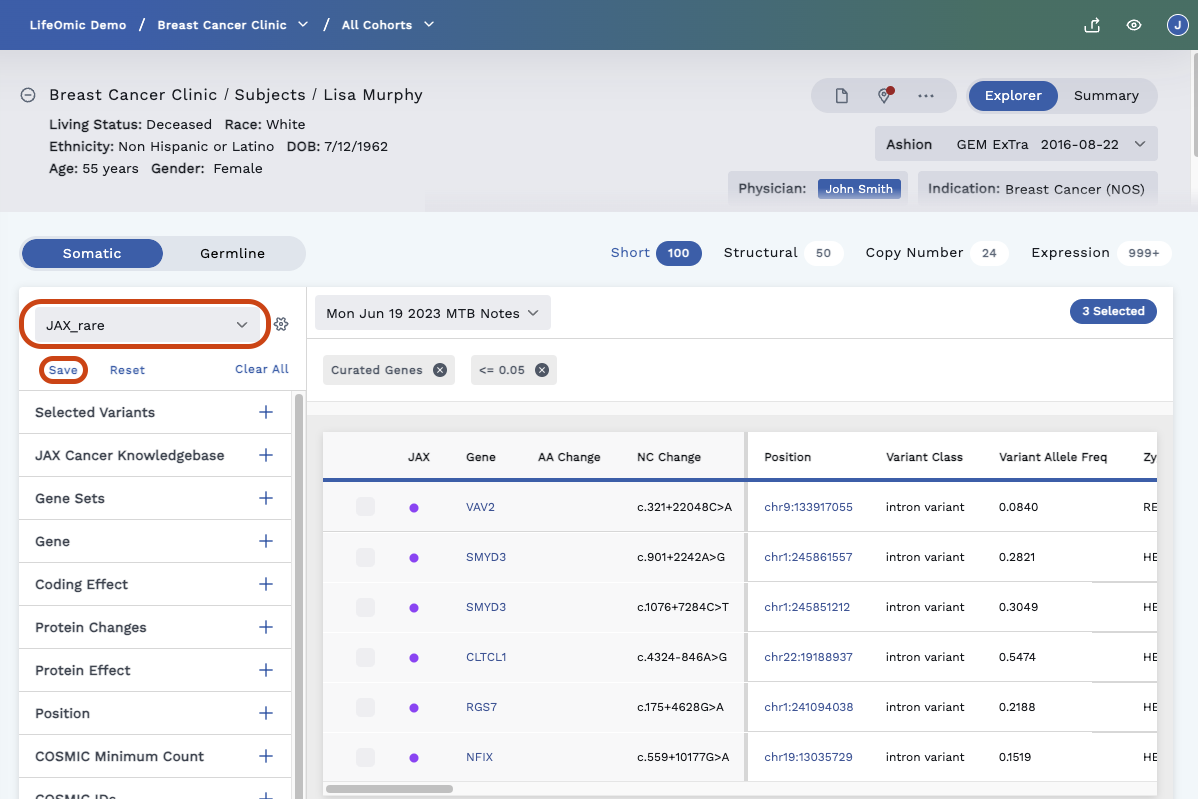
Create a Saved Filter
-
Select the filtering criteria from the filters on the left side of the page.
-
Click the Save button (see above image) beneath the filters dropdown menu.
-
In the dialog that opens, name your filter and give it a description.
-
To create a filter, toggle on the Create as a new saved filter switch.
-
To set this as the Default Filter, toggle on the Set as default filter switch. This applies a single filter automatically for the selected sequence and variant combination (such as Somatic + Short). The default filter applies to the whole project. To remove a default filter, delete the filter or replace it with a new filter.
-
Click Save.
This filter will now be available in the filters dropdown.
Filter and Saved Filter Tools
The three tools allow you to save a filter, reset to the currently loaded filter, or clear all filters.
-
Save - Users with the
Layout AdminABAC privilege can click this button to save/modify a filter.If you load a Saved Filter from the dropdown menu and add more filters to that base, the Saved Filter dropdown will now say "Modified."
Users with the
Layout AdminABAC privilege can save this modified filter as a new filter with a new name. Only the filter owner or a project admin can update an existing filter created by another user. -
Reset - Clicking the Reset button removes any added filters and restores the Saved Filter.
-
Clear All - Clicking this button removes all selected filters, including Saved Filters. This will cause the Omics Explorer table to display all unfiltered data.
Delete a Saved Filter
Only users with the Layout Admin ABAC privilege or the filter creator can delete a Saved Filter.
-
Click on the Saved Filters settings icon to open the Manage Saved Filters page.
-
On the Manage Saved Filters page that opens, click the trash can icon beside the filter you wish to remove.
List of Filters
The list of filters available varies depending on which Variant Type (Short, Structural, Copy Number, or Expression) is selected. Once a filter is selected, a chip is placed above the Omics Explorer table.
-
JAX Cancer Knowledgebase - The Jackson Labs Clinical Knowledgebase (JAX CKB) is a cancer variant, clinical trial matching and therapeutic evidence knowledgebase.
-
Gene Sets - This is a list of genes. By default, a selection of gene sets auto-populates into every project. Define and create gene sets with the Knowledge tab of the LifeOmic Platform. For more information, see Knowledge.
-
Gene - (separate multiples with a comma) Use the search box to search the populated gene list or manually enter the gene(s) you wish to filter on.
-
Populated List - Begin typing the gene name to search from our populated list pulled from the HGNC database. A list with any matches will populate, along with the full gene name as well as any aliases for that gene.
-
Manual Entry - You can manually enter the gene name, then hit "enter." This option exists for two reasons:
- To allow users to locate gene names that are in the data but are not in the populated list
- To list multiple genes (separate the genes with a comma)
-
-
Coding Effect - These are the types of mutations that affect the RNA and protein coding (this shows up in the Variant Class column of the Omics Explorer Table)
- Frameshift
- Splice region - Using the SnpEff annotation tool, a
splice_region_variantcan be one of the following:splice_site_regionsplice_site_branchsplice_site_branch_u12
- Splice site - A variant in one of the canonical splicing donor or acceptor base pairs [GT/AG] at the exon/intron boundary. See SnpEff annotation tool for more info.
- Stop lost
- Start lost
- Nonsense
- Inframe
- Missense
- UTR3
- UTR5
- Synonymous
-
Protein Changes (add – separate with comma) - This data will be seen under the AA Change(Amino Acid) Column of the Omics Explorer table
-
Position – Position refers to the numeric chromosome position (enter value)
-
COSMIC Minimum Count – (enter value) This refers to how often a mutation has been seen in the COSMIC (Catalog of Somatic Mutations in Cancer) external database. Typing a "1" in the search box would let you know if anything had ever been found in COSMIC. The result would be seen under the Omics Explorer table column, COSMIC Count.
-
COSMIC IDS – This is the numeric COSMIC ID of a mutation. This ID number links to the COSMIC website. Enter a value in the box (multiples separated by a comma).
-
dbSNP rs IDs – This ID number will link out to the dbSNP (database of Single Nucleotide Polymophism) website. Enter a value in the box (multiples separated by a comma).
-
ClinVar Significance checkboxes
- Pathogenic or Likely Pathogenic
- Uncertain significance
- Benign or Likely Benign
- Conflicting interpretations
- Association
- Risk factor
- Drug Response
- Not provided
-
ClinVar Review Status checkboxes (can select multiple)
- Practice Guideline
- Reviewed By Expert Panel
- Criteria Provided, Multiple Submitters, No Conflicts
- Criteria Provided, Single Submitter
- Criteria Provided, Conflicting Interpretations
- No Assertion Criteria Provided
- No Assertion Provided
- No Interpretation for the Single Variant
-
Pop Freq (gnomAD database) - (search via value boxes) This numeric value (found under the Genome Frequency column of the Omics Explorer table) is brought in by the gnomAD database and tells how frequently a variant is in the genome.
-
>=Allele Frequency- add a value between 0.0 and 1.0 (if blank it's treated as 0) -
<=Allele Frequency- add a value between 0.0 and 1.0 (if blank it's treated as 0)Note: If you set this filter, then go back and change the values, it will not add a new filter, instead, it will replace the previous Pop Freq values.
-
-
Maximum Across Populations - (value boxes) The frequency of a variant is often variable across racial ancestral populations (That is, European, Asian, African, and so on) and the overall average frequency does not always reflect whether the variant is rare or common within each subpopulation. The ‘Max Across Populations’ represents the single highest frequency the variant is found across all racial ancestral populations (regardless of which population). This is most helpful to filter for variants that are rare across all populations, for example, by setting the filter to (\ >= Min ‘0’ and <= Max ‘0.001’).
>=Allele Frequency<=Allele Frequency
-
Gene Class - This data is brought in from a public tool
- Protein Coding
- Pseudogene
- Micro RNA
- Short ncRNA
- Long ncRNA
- Immunoglobulin
- T Cell Receptor
-
Zygosity
- Heterozygous
- Homozygous
- Reference - In cases where a particular genetic assay shows if it matches the reference genome, this checkbox allows you to search for those matches
-
Variant Quality
-
Variant Allele Freq - Value boxes
>=Allele Frequency<=Allele Frequency
-
Combined in Silico Prediction
- Select % Damaging or Damaging Rank Score
>=<=
-
Individual In Silico Predictors
- Predictor – Select between FATHMM, SIFT, MUT Taster
- Deleterious
- Tolerated
-
JAX Clinical Knowledgebase
- In JAX - Displays any variant that has an annotation in the JAX knowledgebase in any transcript
-
Protein Effect (multiple can be selected)
- Gain of Function
- Gain of Function - Predicted
- Loss of Function
- Loss of Function - Predicted
- No Effect
- No Effect - Predicted
- Unknown
Variant Count – Tells how many variants meet the selected filters. Anything over 999 is annotated as 999+. However, infinite scrolling allows you to see all the variants in the Omics Explorer table.