Variant Detail Page
Users can access detailed information about a particular variant using the Variant Detail page.
Display Variant Details Page
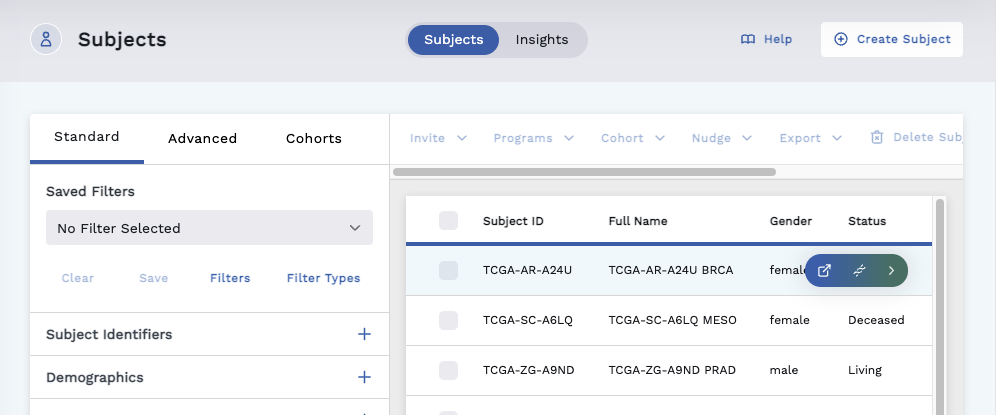
- Click Subjects tab.
- Mouseover a subject row to reveal options and click the Omics Explorer icon.
- On the Omics Explorer page, click anywhere on the gene row, except for a hyperlink, to display the variant details page.
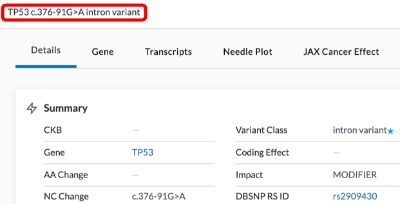
Headers
At the top of the Variant Detail page is a header that includes info based on the selected variant (such as Amino Acid Change, Nucleotide Change, & Variant Class)
You can open the tabs along the top of the page to view available information regarding:
- Details
- Gene
- Transcripts
- Needle Plot
- JAX Cancer Effect
- JAX Gene-Drug Evidence
- Reference Tissue Expression
- CKB
- Cancer Prevalence
Details Tab
The details page displays the data of the Omics Explorer table in a grouped format.
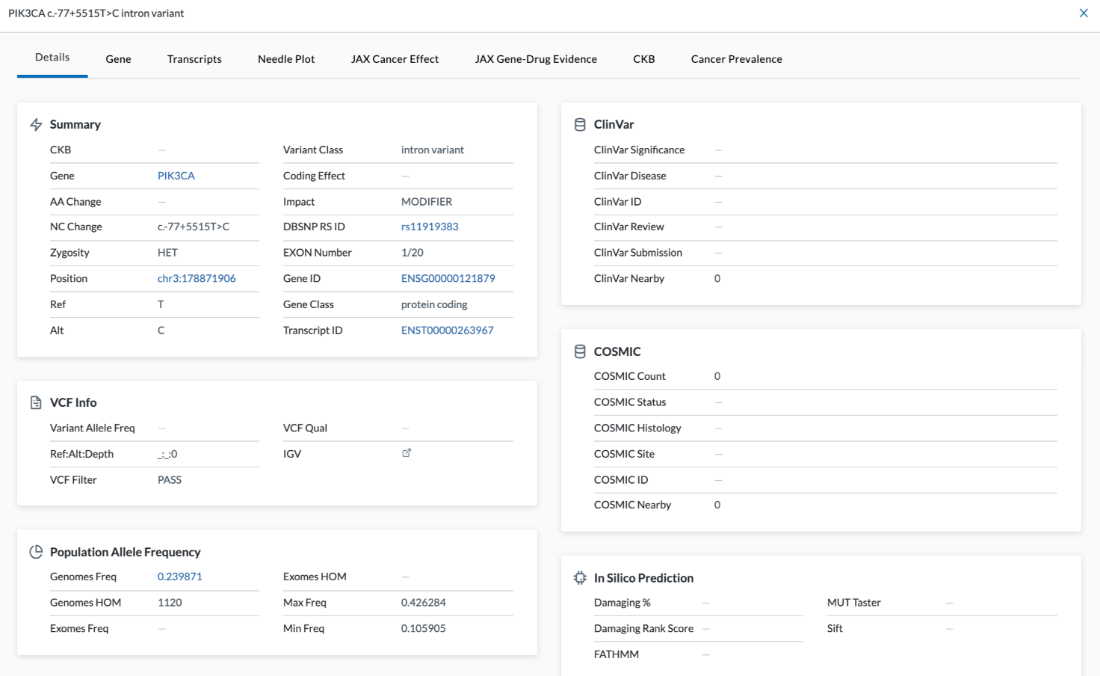
The details shown will depend on the variant selected.
Summary
- CKB - Cancer Knowledge Base
- Gene - Gene name
- AA Change - Amino Acid Change
- NC Change - Nucleotide Change
- Zygosity
- Position Refers to the numeric chromosome position
- Ref
- Alt
- Variant Class
- Coding Effect - These are the types of mutations that affect the RNA and protein coding
- Impact
- DBSNP RS ID - This ID number will link out to the dbSNP (database of Single Nucleotide Polymophism) website.
- EXON number
- Gene ID
- Gene Class
- Transcript ID
VCF Info
- Variant Allele Freq
- Ref Alt Depth
- VCF Filter
Population Allele Frequency
- Genomes Freq
- Genomes HOM
- Exomes Freq
- Exomes HOM
- Max Freq
- Min Freq
ClinVar
- ClinVar Significance
- ClinVar Disease
- ClinVar ID
- ClinVar Review
- ClinVar Submission
- ClinVar Nearby - This feature was added by LifeOmic. If there’s a variant for a gene, this will look in ClinVar to see if there is anything two or three amino acids in either direction that may be of significance.
COSMIC
- COSMIC Count
- COSMIC Status
- COSMIC Histology
- COSMIC Site
- COSMIC ID - This is the numeric COSMIC ID of a mutation. This ID number links to the COSMIC website.
- COSMIC Nearby - If COSMIC Count is one and COSMIC Nearby is one, it means the variant has been seen once in COSMIC and there is a variant nearby
In Silico Prediction
- Damaging %
- Damaging Rank Score
- FATHMM
- MUT Taster
- Sift
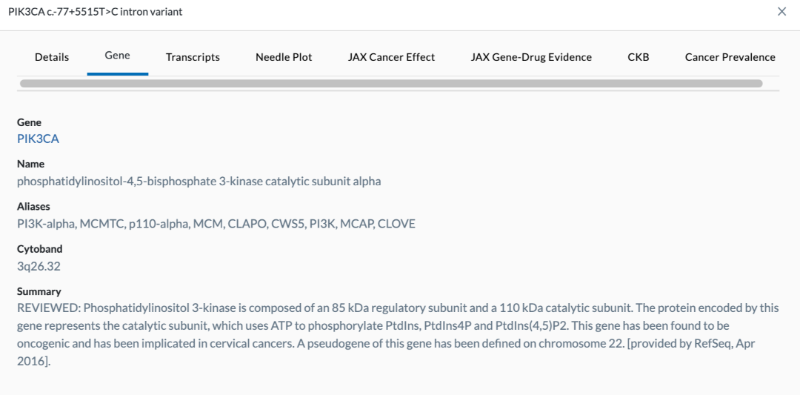
Gene Tab
The Gene tab gives more information about the gene. This information is brought in from an external source (referenced in the summary).
Summary Info
- Gene
- Name
- Aliases
- Cytoband
- Summary - Tells more information about the gene
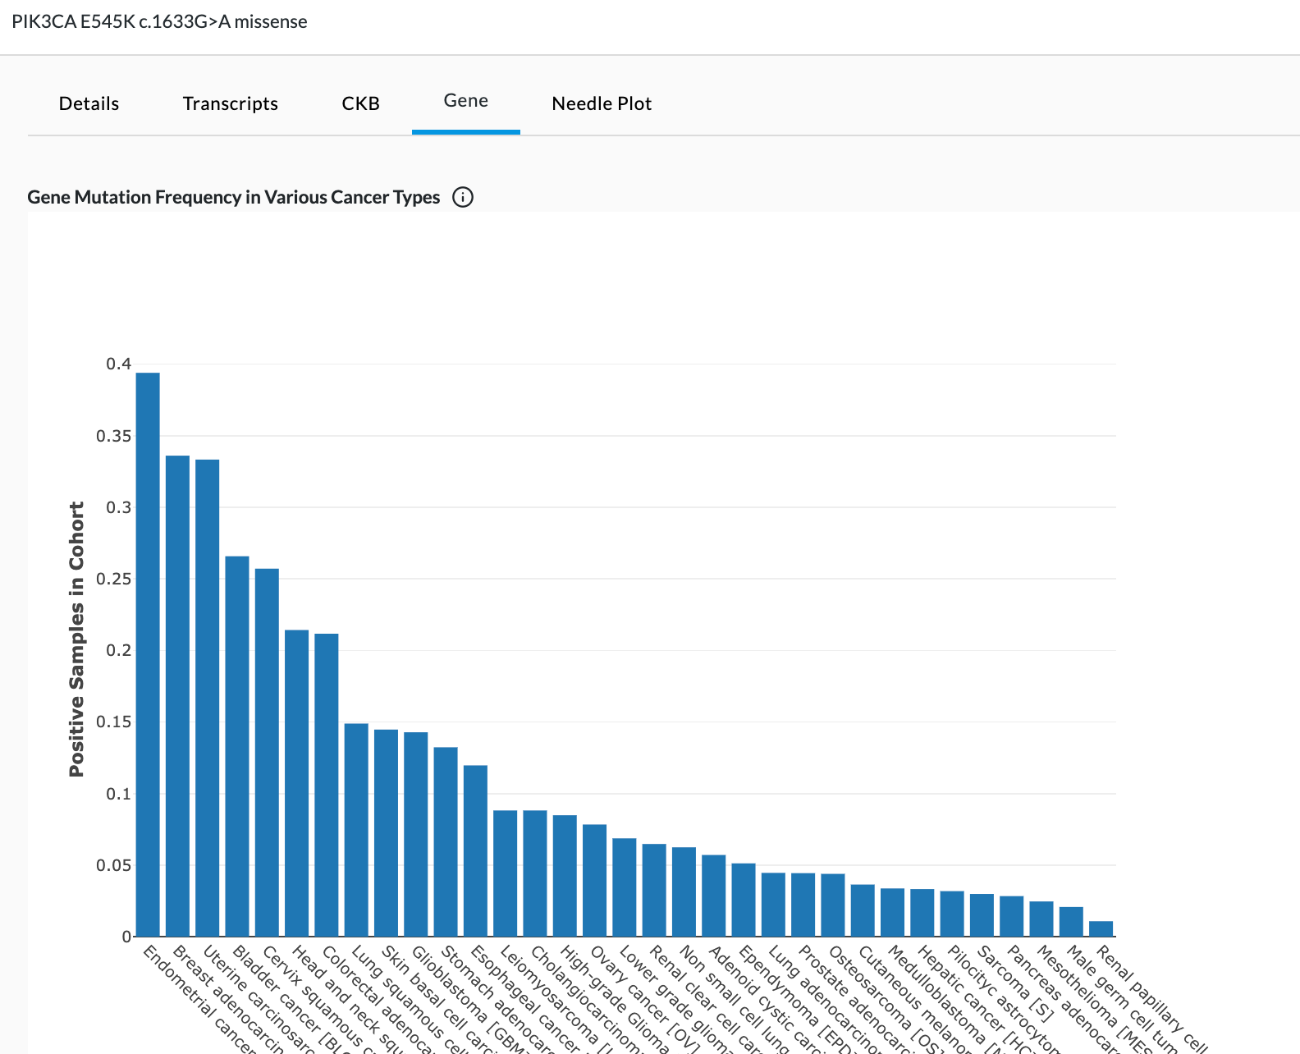
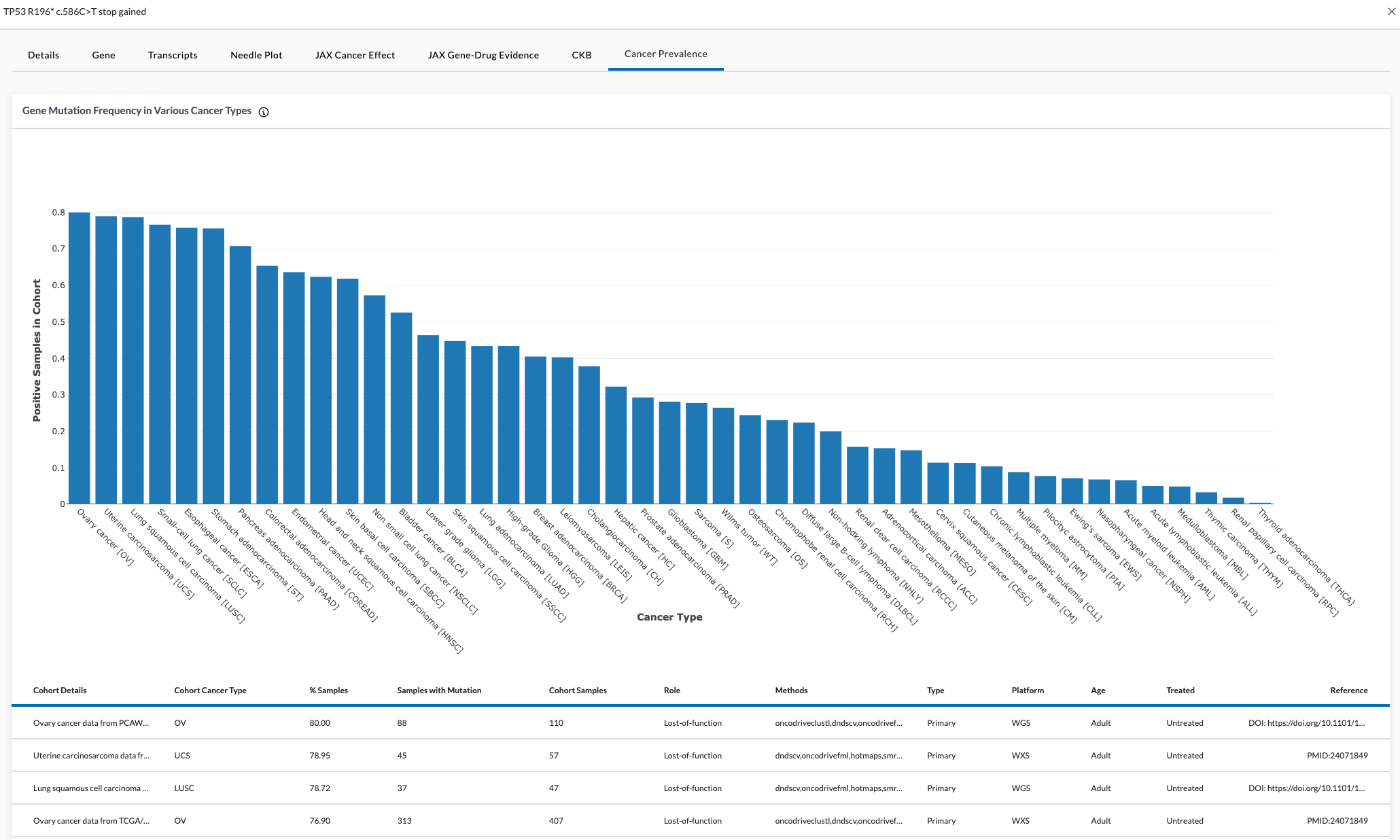
Bar chart
The bar graph shows details of published cancer studies where the gene is predicted to act as a cancer driver. This data comes from an external database. The bar chart shows the gene mutation frequency or where it's a driver gene in various cancer types (as shown below). Hovering over the info button (i) in the graph title will reveal a popup stating "This bar chart and table show details of published cancer studies where the gene is predicted to act as a cancer driver. All studies are listed in the table and those cohorts with at least 30 samples are plotted in the bar chart."
Table
The data found in the table shows details of published cancer studies where the gene is predicted to act as a cancer driver. This data comes from an external database called Intogen. Intogen curates the frequency of mutated genes in different cancer types (see image below). The table cannot be filtered or interacted with. In this external reference data set, they’ve taken different cancer types and looked at the samples with mutations compared to the overall in their study cohort and derived a frequency (% samples). They include information such as if the sample is WGS (Whole Genome) or WXS (Whole Exome), whether they were treated or untreated when they were sequenced (before or after any cancer treatment), and "Reference" refers to where the data came from PMID is PubMed ID. Users can copy and paste the reference info into a browser for more info on the study where that data came from.
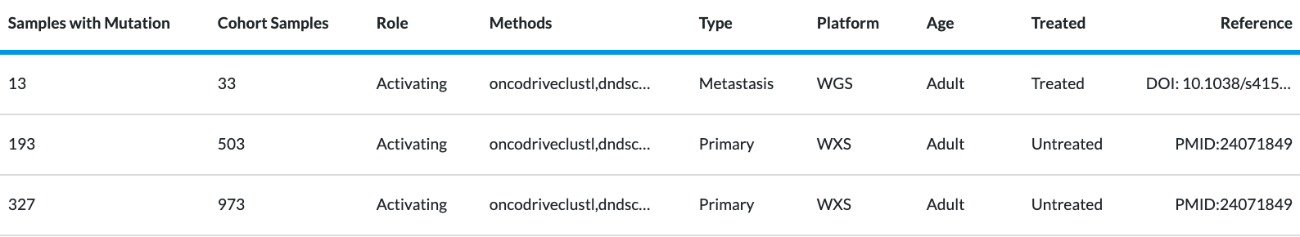
Data in this table includes:
- Cohort Details
- Cohort Cancer Type
- % Samples - Found by taking different cancer types, looking at the samples with mutations compared to the overall in their study cohort, and deriving a frequency.
- Samples with Mutation
- Cohort Samples
- Role
- Methods
- Type
- Platform (WGS = Whole Genome, WXS = Whole Exome)
- Age
- Treated - Treated or untreated when sequenced or before/after cancer treatment
- Reference - Where the data came from. PMID is the PubMed ID. You can copy and paste the reference info into a browser for more info on that study and where the data originated.
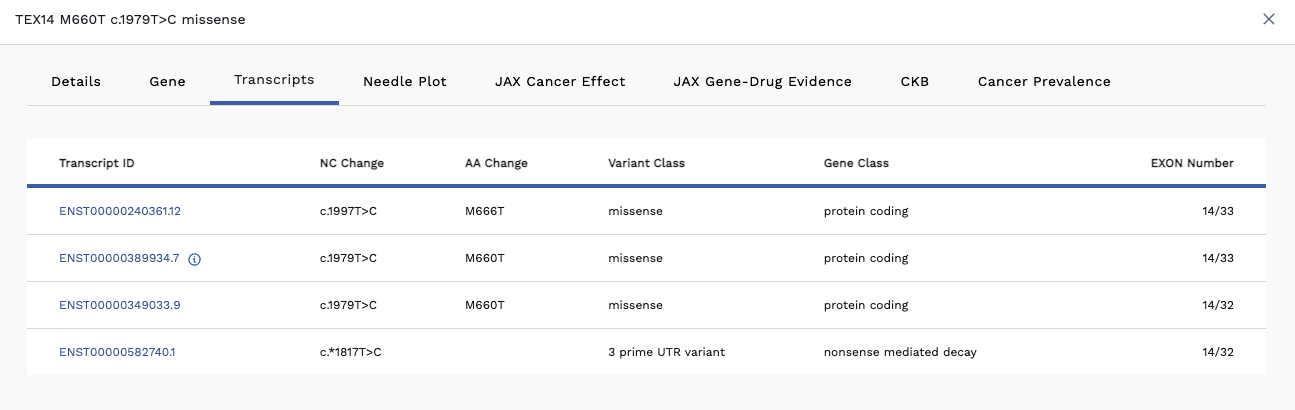
Transcripts Tab
Genes can have many different transcripts. While they are all the same gene, they have different splicing/different exons. If you click on the Transcripts tab, you will see an Alternate Transcripts table. Here we denote the canonical transcript with a blue "i" info icon beside the transcript id. All other transcripts are listed beneath it (see image below).
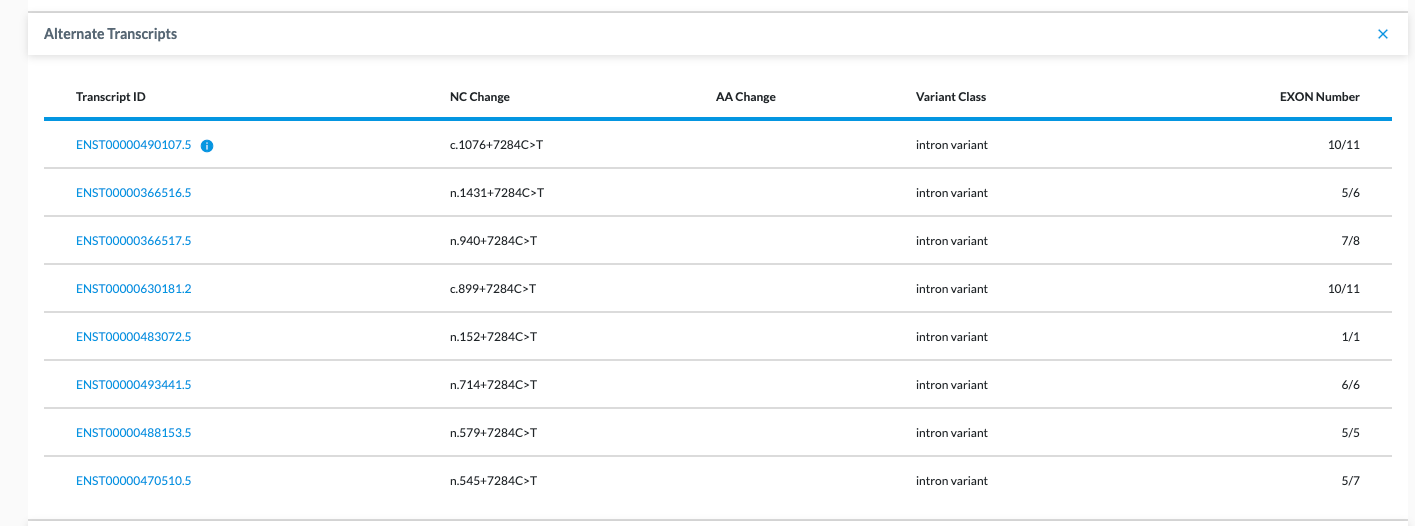
Table Columns
- Transcript ID – Most canonical transcripts have a blue info dot beside it. If there is no dot, it means there is no canonical transcript identified because the way it was annotated did not specify it was part of the same gene.
- NC Change
- AA Change
- Variant Class
- Gene Class
- EXON Number
Needle Plot Tab
The Needle Plot is a visual representation of where that mutation occurs in the protein. Needle Plots frame how important this variant is by giving a clinician or researcher a quick reference point of how often this variant has been seen in cancer. It lets them know if it’s common and if it’s not, is it near a common variant? Or is it clustering near other mutations?
If you look at the Needle Plot example below, for gene PIK3CA, you see high peaks and clusters of needles, showing something is going on in these spots of the gene.
Hovering the cursor over any needle will tell you which mutation is at that needle point.
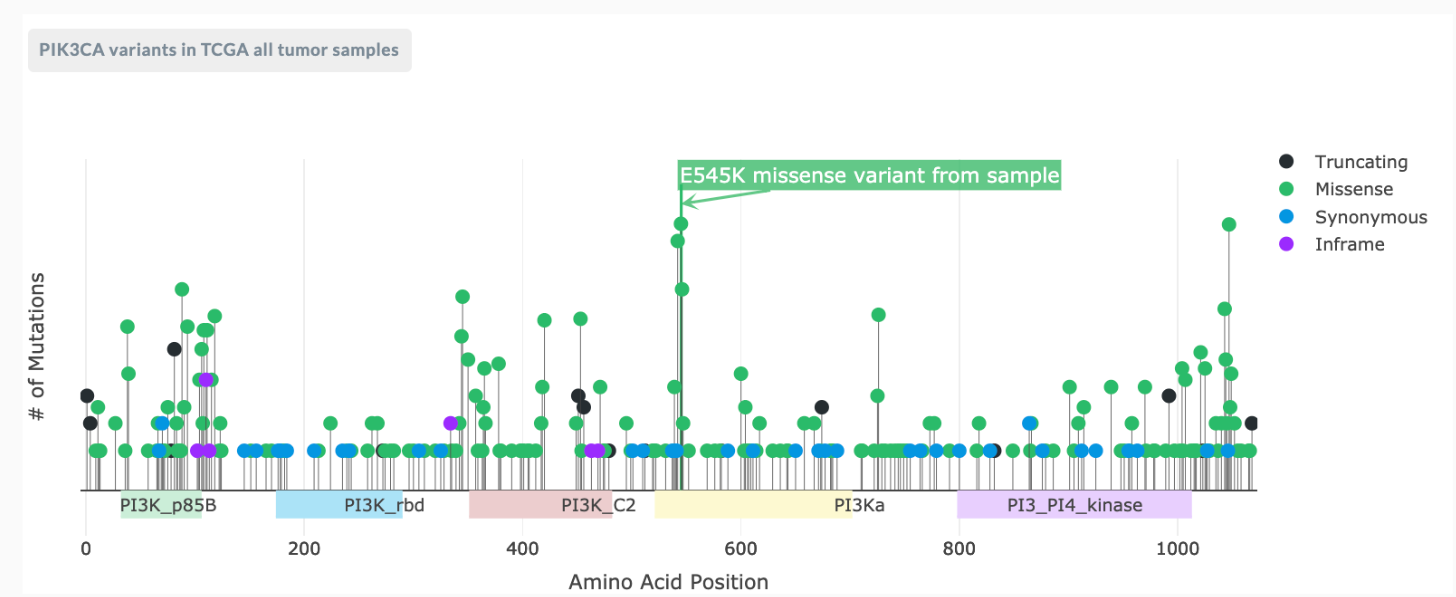
A needle plot is only for coding variants in the exons of a gene (somatic variants). On the top left of the plot is external reference data brought in from TCGA (Cancer genome atlas resource). The needle plot shows you left to right, the position in the protein. It shows you where the variant is for the patient with the blue flag.
There is a key to the right corresponding with the flag color:
- black = truncating
- green = missense
- blue = synonymous
- purple = inframe
The other needles on the plot come from TCGA’s tumor sample pool. You can hover over each one and it will show you the mutation found and how many have been found in TCGA. Beneath the line with the needle plot are colored bars with info in them. These are protein domains (a special part of the protein with a known/presumptive function – this data comes from another database, PFFam). You can click and drag from top left to bottom right of a section of the needleplot to zoom in.
JAX tabs
The JAX Cancer Effect tab and the JAX Gene-Drug Evidence tabs of the Variant Detail page display clinician-friendly information from the JAX database regarding genes and variants related to cancer.
Contact LifeOmic for access to the JAX tabs for your LifeOmic Platform account.
JAX Cancer Effect
The JAX Cancer Effect tab illustrates the connection between a specific mutation and whether that mutation causes cancer, has no effect, or is unknown. The data on this page is auto-filtered to only display info related to the gene displayed. A filter chip for this gene is located at the top left of the table. If you remove this filter by clicking the for the chip, all mutations for the gene will be displayed. If you select multiple filters, the results displayed are "anded," meaning display filter "x" and filter "y."
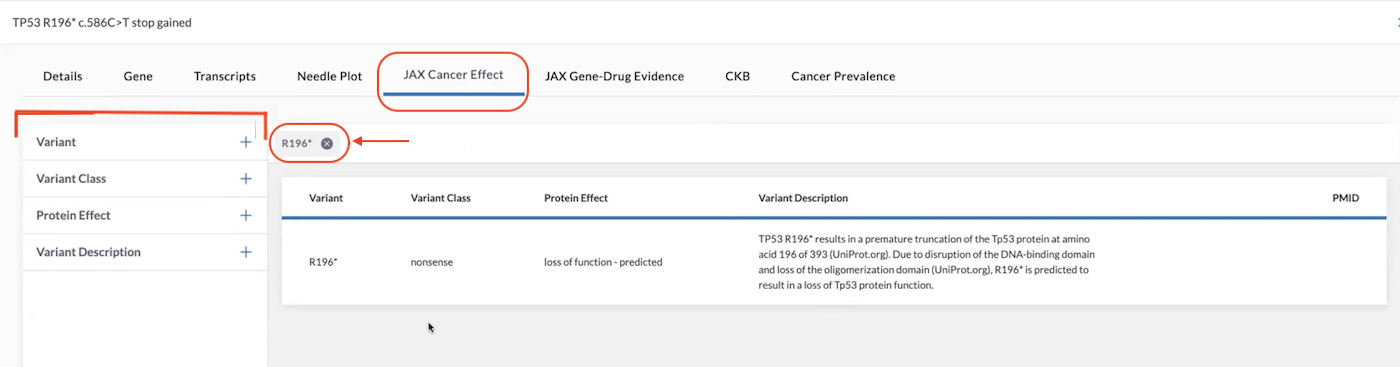
Filters on the left side of the page help you search deeper or locate other data related to the gene. Once you select a filter, a chip will be placed above the table denoting the filter in place.
An auto-search function exists allowing the user to drill down through all transcripts to the variant of interest in the JAX knowledgebase. The variants present as chips above the JAX Cancer Effect data associated with the gene and can be removed by clicking the "X" beside the chip.
Filters
Filters available are listed below.
Variant
Variant
Search box
Variant Class
Variant Class
- Deletion
- Duplication
- Frameshift
- Fusion
- Indel
- Insertion
- Missense
- None
- Nonsense
- Splice Site
- Unknown
Protein Effect
Protein Effect
- Gain of Function
- Gain of Function - Predicted (There is peer-reviewed literature with modest functional evidence demonstrating that the gene alteration present results in activity similar to that of the wild-type and does not demonstrate tumorigenic attributes.)
- Loss of Function
- Loss of Function - Predicted (There is peer-reviewed literature with modest functional evidence demonstrating that the gene alteration present results in activity similar to that of the wild-type and does not demonstrate tumorigenic attributes.)
- No Effect
- No Effect - Predicted (There is peer-reviewed literature with modest functional evidence demonstrating that the gene alteration present results in activity similar to that of the wild-type and does not demonstrate tumorigenic attributes.)
- Unknown
Variant Description
Variant Description
- Use the search box to search for specific verbiage within the variant description
Table columns include information on the Variant, Variant Class, Protein Effect, Variant Description, and PMID (PubMed ID).
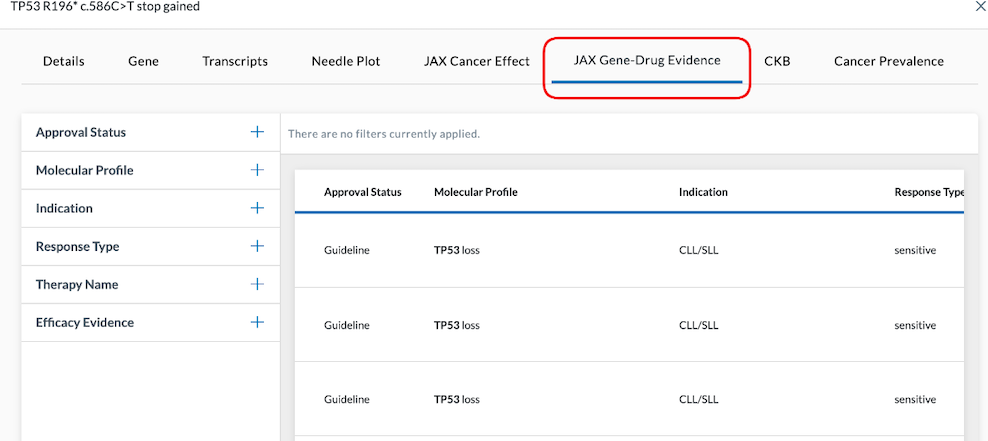
JAX Gene-Drug Evidence
The JAX Gene-Drug Evidence tab illustrates the connection between cancer types with a particular set of molecular attributes and the approval status of a drug. It also shows the effect it has when trying to treat that cancer against the mutations present in the molecular profile.
Filters
Filters available are listed below.
Approval Status
Approval Status - Where it is in the FDA Approval Process
- Case Reports/Case Series
- Clinical Study
- Clinical Study - Cohort
- Clinical Study - Meta-analysis
- Expanded Access
- FDA Approved
- FDA Approved - Has Companion Diagnostic
- FDA Approved - On Companion Diagnostic
- FDA Contraindicated
- Guideline
- Phase 0
- Phase I
- Phase IB/II
- Phase II
- Phase III
- Preclinical - Pdx
- Preclinical
- Preclinical - Cell culture
- Preclinical - Cell line xenograft
- Preclinical - Patient cell culture
- Preclinical - Pdx & cell culture
Molecular Profile
Molecular Profile - Amino Acid Changes
- Search box
Indication
Indication - Type of Cancer
- Search box
Response Type
Response Type - Tells if the Effect is Beneficial or Detrimental
- Conflicting
- Decreased Response
- No Benefit
- Not Applicable
- Not Predictive
- Predicted - Resistant
- Predicted - Sensitive
- Resistant
- Sensitive
- Unknown
Therapy Name
Therapy Name - Name of Drug(s)
- Search box
Efficacy Evidence
Efficacy Evidence - Explanation of Therapy
- Search box
omics-variant Table Columns include information regarding Approval Status, Molecular Profile, Indication, Response Type, Therapy Name, and the Efficacy Evidence. They are sorted by where they are in the approval process, with the highest approval confidence shown at the top of the table.
CKB Tab
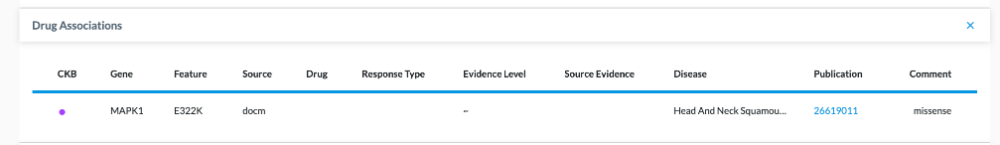
The CKB tab displays drug matches that correlate with the tumor variants.
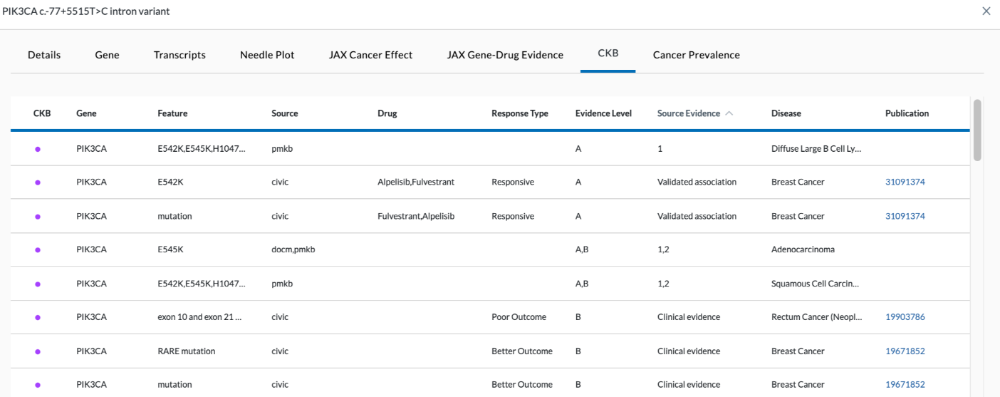
CKB/Drug Association Table Columns:
- CKB - In the Cancer Knowledge Base
- Gene – Gene name
- Feature - Mutation
- Source – Source external database (civic, cosmic_resistmut, docm, pmkb, cgi)
- Drug – Name of drug associated with it
- Response Type – Tells how responsive it is to the drug. (Resistant, Responsive, better outcome, poor outcome)
- Evidence Level – AB, A (clinical practice/standard of care), B (some sort of clinical trial/off-label use data), C (early clinical trials/one case showed benefit), D (preclinical/mouse studies)
- Source Evidence – 1, 2, 3, Clinical evidence, Preclinical evidence, Validated association, Case study, Early trials
- Disease – Disease information (location/type)
- Publication – Links out to PubMed article regarding any gene drug association
- Comment - Any additional information is noted here
Cancer Prevalence Tab
This page displays how often a particular gene is mutated across various cancers. The data comes in from external sources. This information is useful when you are unsure what type of tissue the cancer originates from.
The graph is shown as proportions. For example, in the image below, TP53 is indicated in 80% of Ovarian Cancers.
Data in the table includes:
- Cohorts Details
- Cohort Cancer Type
- % Samples
- Cohort Samples
- Role
- Methods
- Type
- Platform
- Age
- Treated status
Reference Tissue Expression Tab
The Reference Tissue Expression tab is for Expression variants only and can be found by doing the following:
-
Navigate to the Ashion/GEM ExTra test (see image below) in the Omics Explorer drop-down. This will display the RNA data.
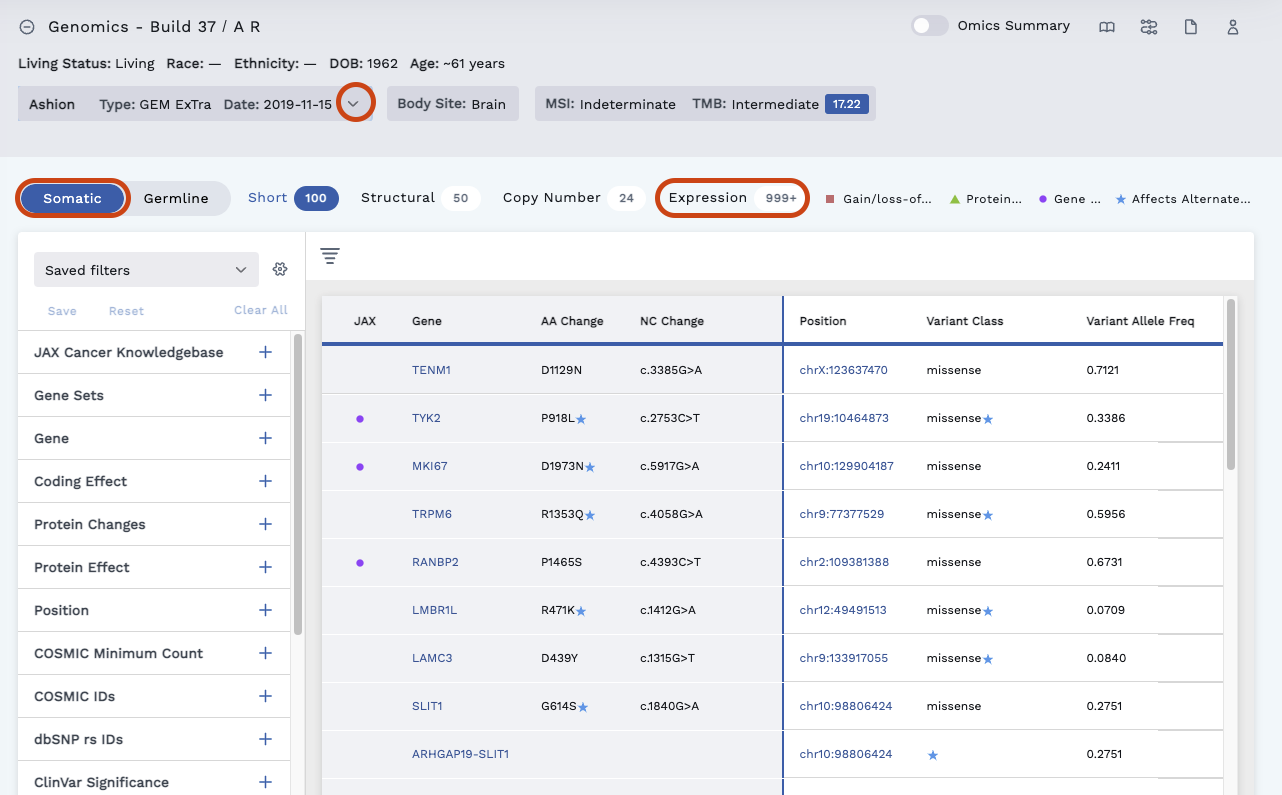
-
Click the Somatic tab and Expression header.
-
Click on any row to view the Variant Details page where you can access the Reference Tissue Expression.
Reference Tissue Expression displays graphed data for:
- TCGA Cancer Type Tumor Samples
- TCGA Normal Samples
- GTEx Normal Broad Tissues
- GTEx Normal Specific Tissues
- TreeHouse Tumor Samples (Pediatric)
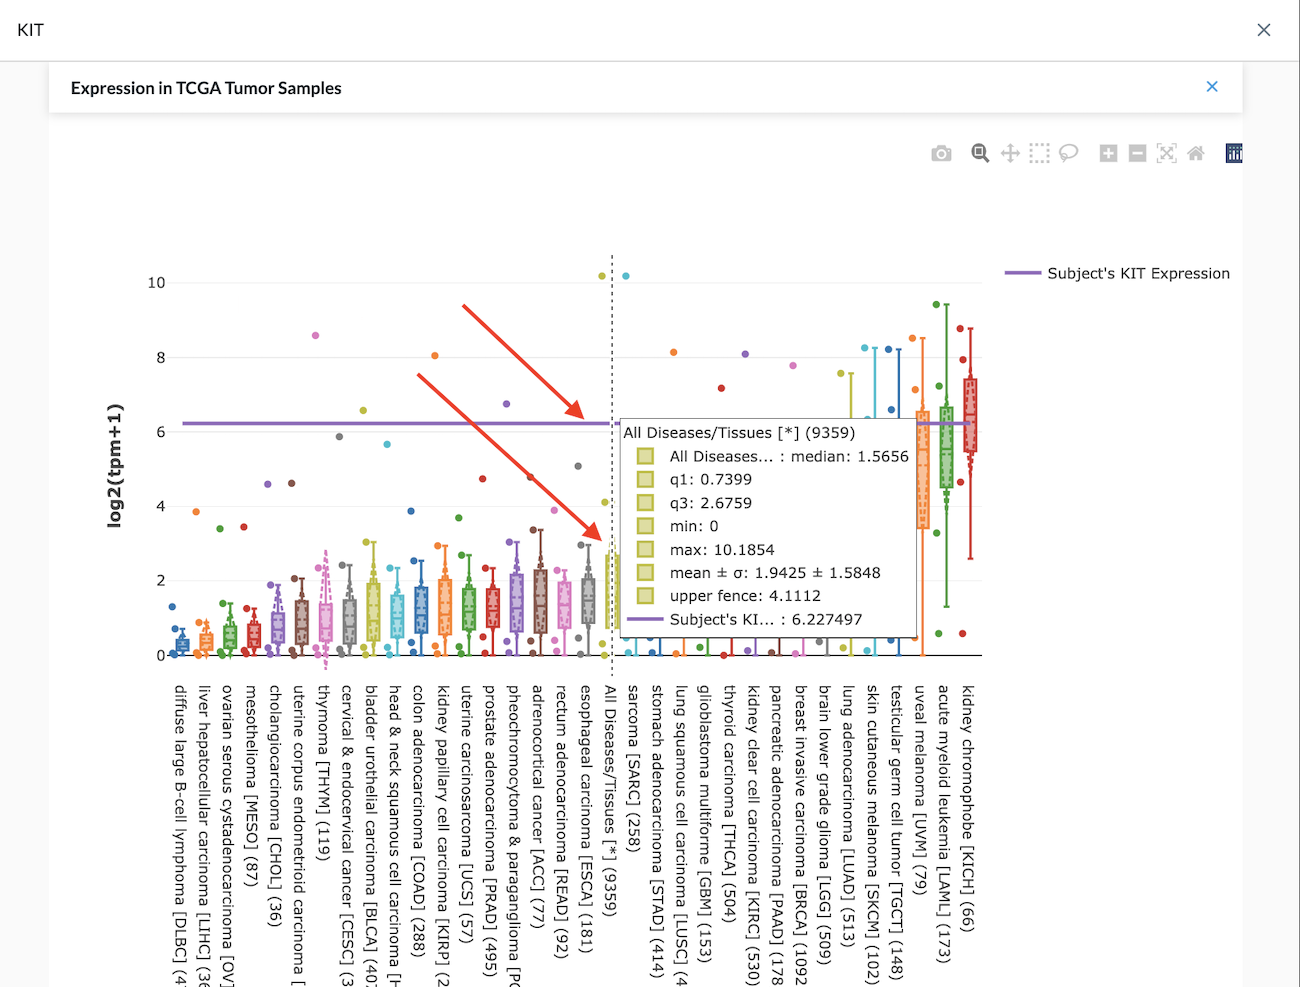
In the example shown in the image above, the purple horizontal line is the Expression for this patient in this sequencing test. The plot allows you to see how this expression relates to other cancer types. In the center of the plot, the chartreuse bar is the sum of All Diseases/Tissues.
If the gene we were looking at is highly expressed such as KIT is in this example, we can return to the Filtered View, click on Outliers to filter the genes that are highly expressed – greater than two std. deviations above the mean for TCGA expression.
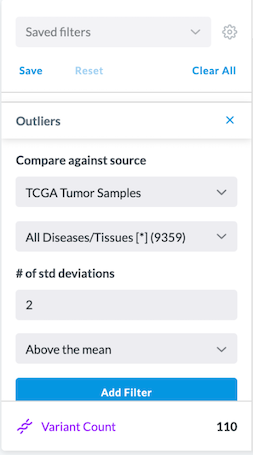
To further filter a highly expressed gene by the number of standard deviations above the mean (as shown in the image below):
-
Scroll down the list of filters and click on Outliers
-
Under Compare Against Source select "TCGA Tumor Samples," and select All Diseases/Tissues
-
Set #of std deviations to "2," and select "Above the mean"
-
Click Add Filter
Special Cases
Gene Match
In the example below, we clicked on the Germline tab, and clicked the checkbox for CKB. The MAPK1 gene came back as a Gene Match, but the Variant Detail page shows no info under Drug Association. This means this gene has a known gene drug association, but this particular variant in this patient sample didn’t have an exact match to a drug.
Standalone Blue Stars
Blue stars appearing alone in a field of the Omics Explorer table means the canonical transcript does not meet that column criteria, but its alternative transcript does meet the criteria. It lets you know there is more information about this gene.
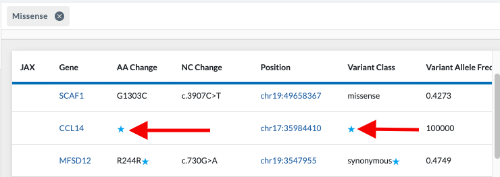
We can also filter for missense variants. The results in the Omics Explorer table shows a variant with a blue star in a blank field under both AA Change and Variant Class. This is because the canonical transcript does not have a missense variant. However, if we hover over the blue star, it shows the alternate transcript which does have a missense variant. This is why it came through as a result for that missense filter.
Affects Alternate Transcript Example
In the example below, we filtered for missense variants. The Omics Explorer table shows a variant with a blue star beside missense under the Variant Class column and a blue star beside the M660T under the AA Change column.
The canonical transcript is a Missense. Hovering over the blue star beside the word missense causes the words 3 prime UTR variant to appear, meaning there is another transcript labelling this mutation as not a missense. Likewise, hovering over the blue star beside the M660T AA Change, displays affects alternate transcript and M666T.
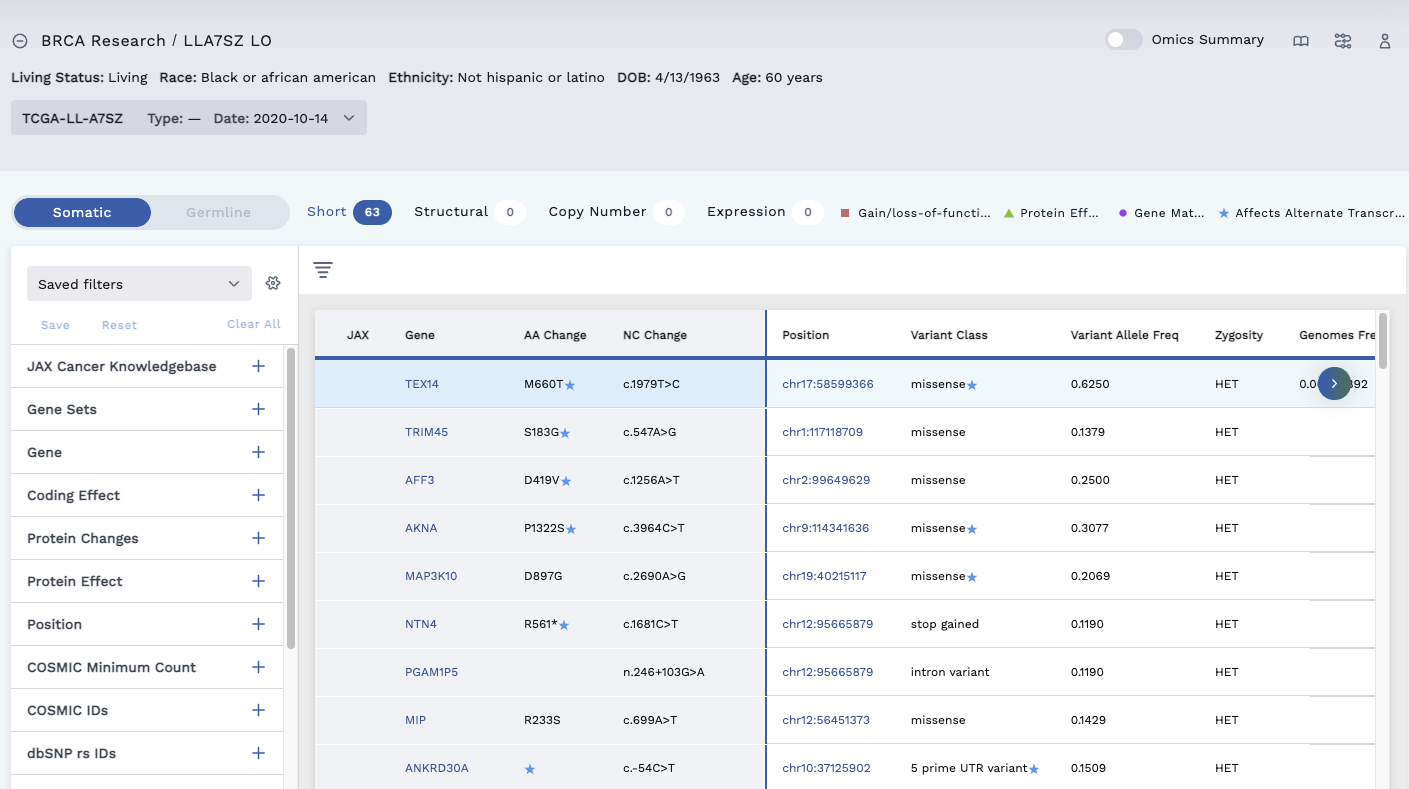
Click on the row to display the Variant Detail page and click the Transcripts tab. This lists the transcripts available and provides details. The seen beside a Transcript ID marks the primary transcript, which is the transcript displayed in the table.