Omics Explorer
The Omics Explorer allows users to view a subject’s genetic test data in an easy to navigate format. It includes annotations from external germline and somatic variant databases.
The video below gives a quick tour of the various features of the Omics Explorer.
Access the Omics Explorer
- Click the Subjects tab.
- Use filters or scroll to locate your subject.
- Hover over the subject's row to reveal and click the Omics Explorer button .
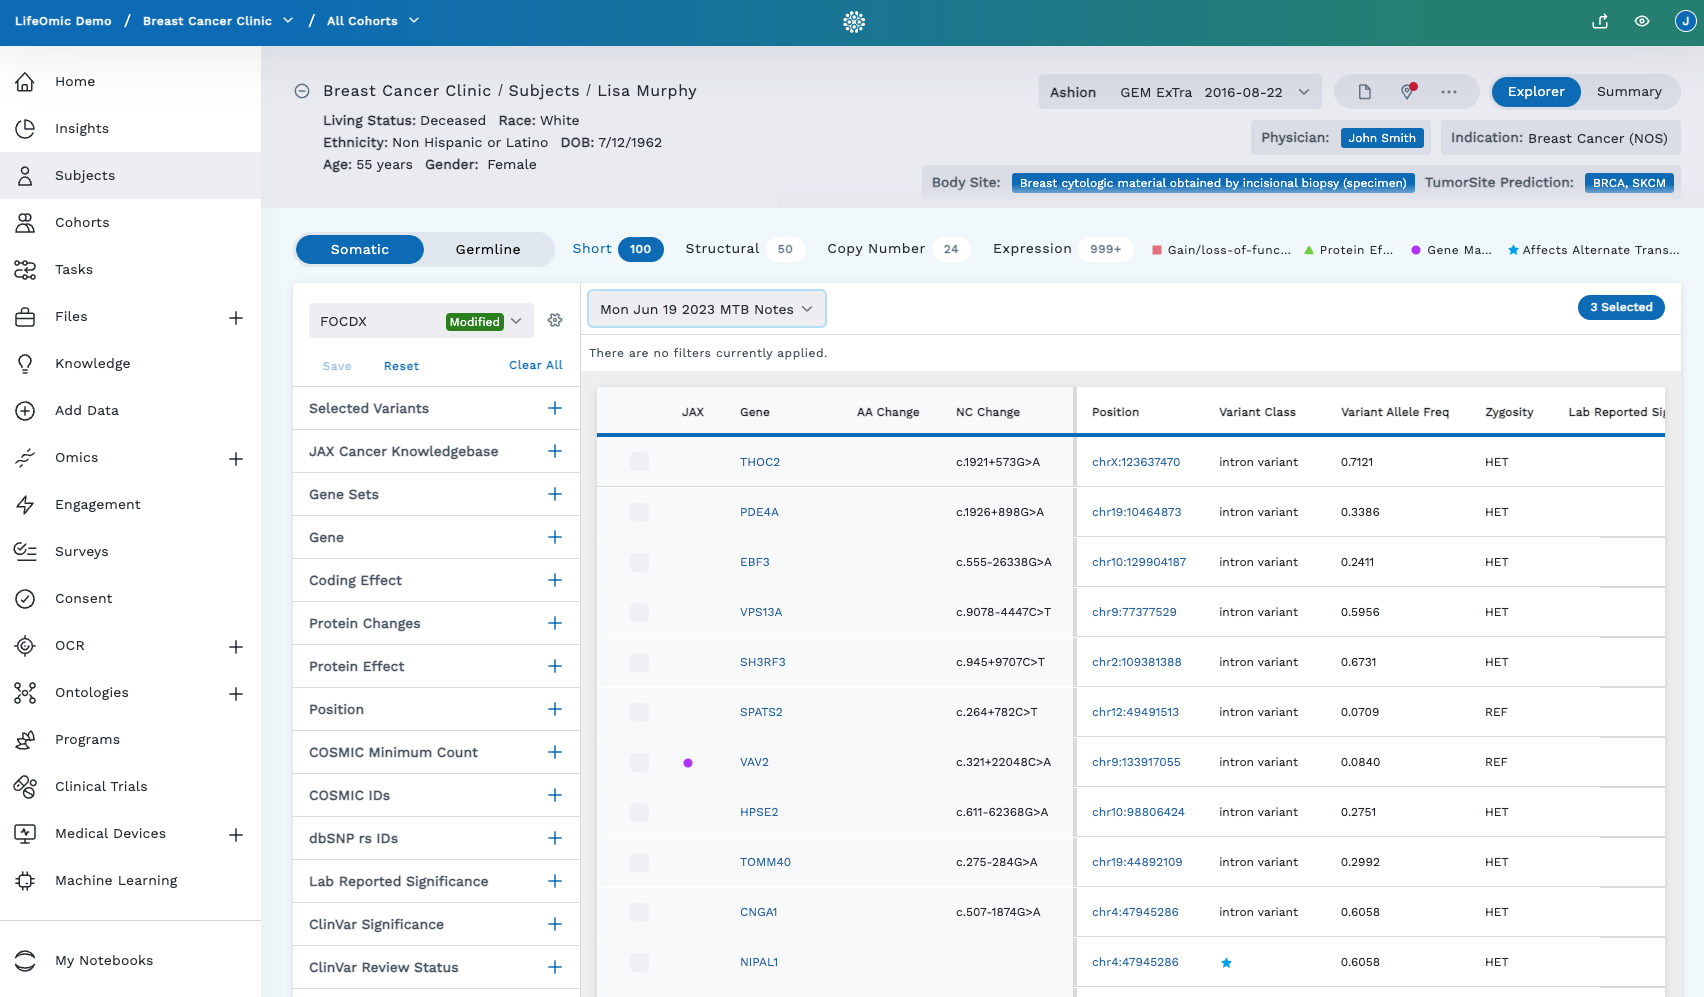
Omics Explorer Layout
The Omics Explorer is laid out with a banner with patient and test/sample info atop the page, a data table, and a column of filters on the left.
Banner
The banner at the top of the Omics Explorer includes the following information:
-
Project Name/Subject Name: Clicking the masked mode icon to unmasked mode in the top right hand corner of the page will change what info is displayed.
-
Basic demographics about the subject (living status, race, ethnicity, DOB, and age)
-
Genetic tests dropdown menu (test data from genetic testing vendors are grouped as a “test”): The most recent test is sorted to the top of the dropdown. Genetic test info includes:
- Sequence Name (test) such as Ashion
- Sequence Type (refers to the type of test)
- Date
-
Body Site: Where tissue sample came from (breast biopsy, saliva, blood, and so on)
-
Tumor Site of Prediction: This prediction uses RNA-seq data to map it to TCGA tumor types to predict where in the body the tumor came from. As data enters the LifeOmic Platform (such as from Ashion), this prediction is initiated as part of the workflow. It's performed using external resources, such as CancerScope[^1], and a tool created by LifeOmic (PCANN).
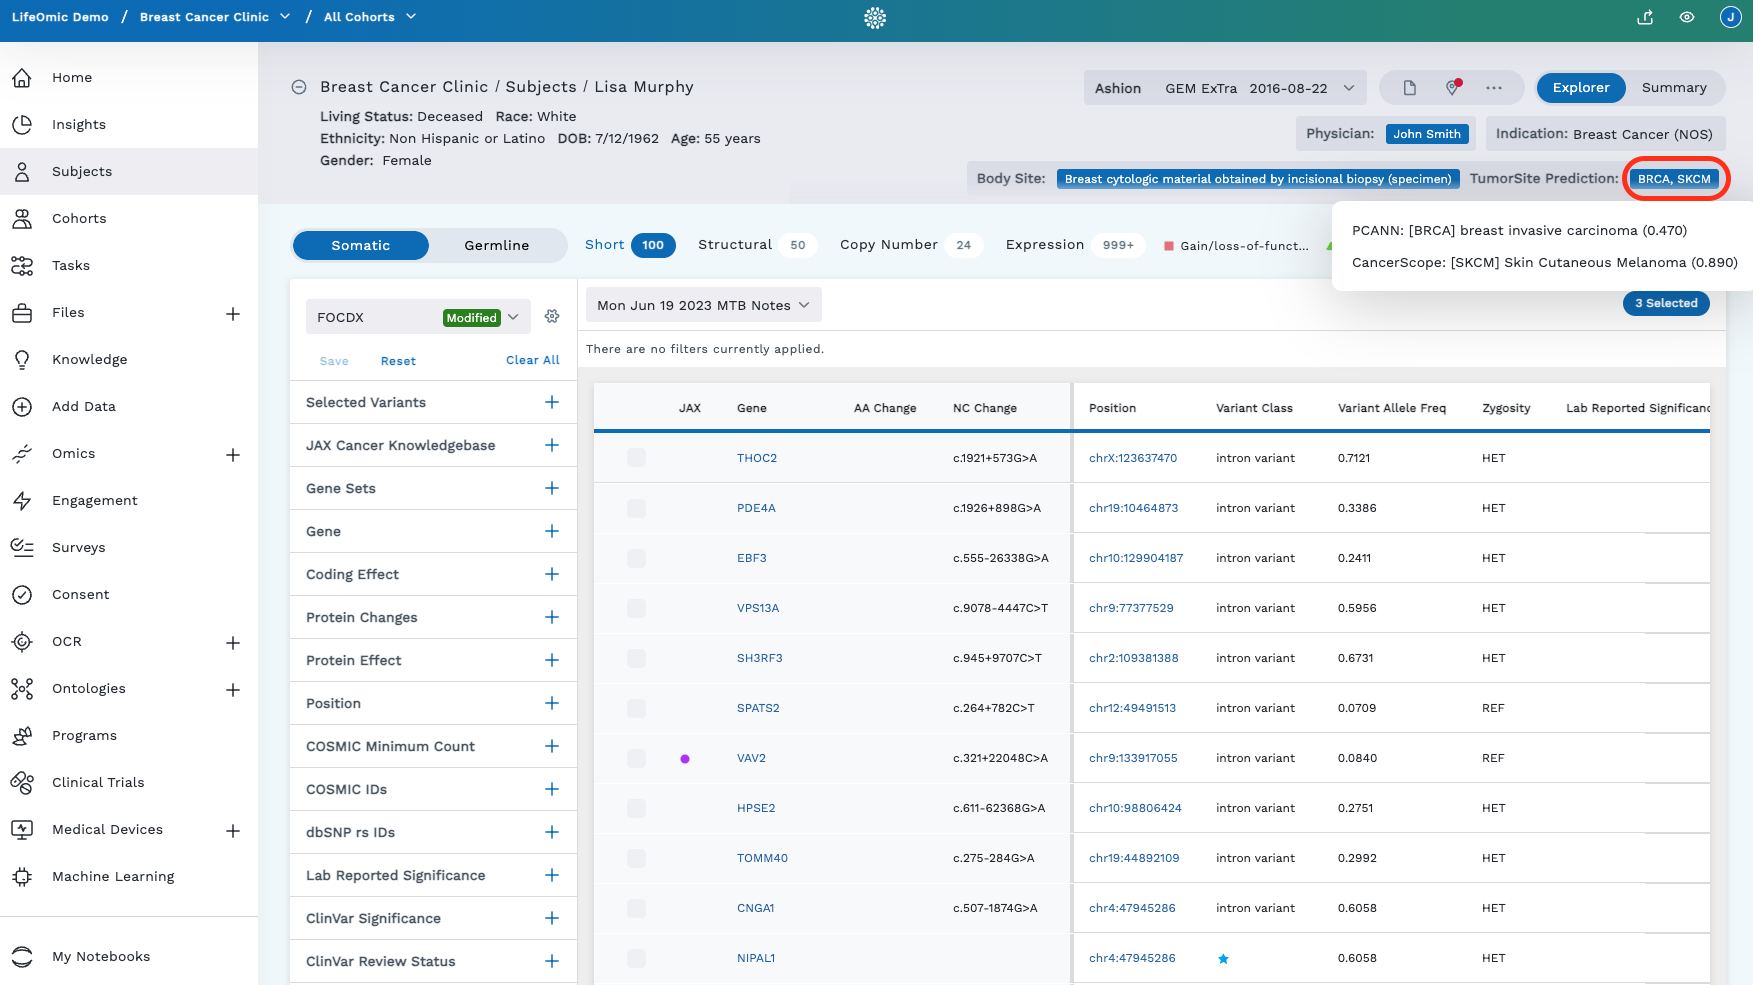
Clicking on the TumorSite Prediction abbreviations in the header gives you a more detailed view:
-
Where the prediction came from (PCANN = a LifeOmic tool, or CancerScope[^1] = an external tool)
-
What site the tumor is predicted to originate from
-
The confidence score of that prediction (zero = least confident, one = most confident)
This is useful especially when the site of origin is unknown, or if it's liver cancer this can help determine if it's liver cancer or breast cancer that metastasized to the liver.
-
-
MSI: Microsatellite Instability: This tells how genomically stable the cancer is:
- Indeterminate: No test performed, the result was indeterminate, or not a strong reading
- Low: Genome is more stable
- High: Lots of instability in the genome
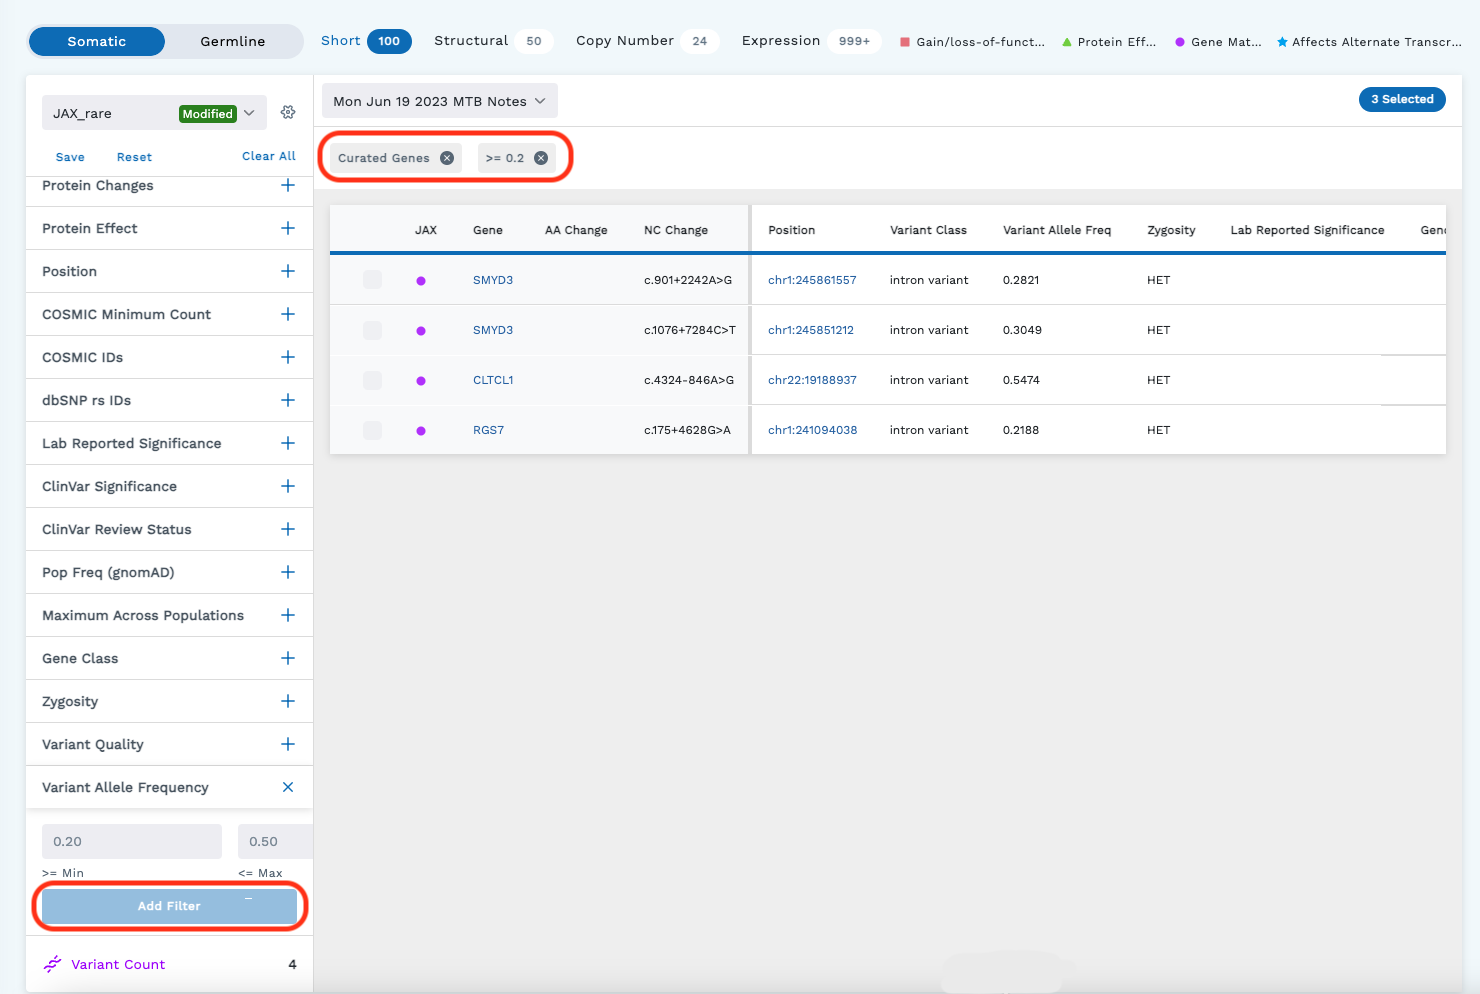
Filters
Beneath the header of the Omics Explorer are filters and the data table. Filters (shown on the left side of the below image) help fine tune your search through the data ingested into the LifeOmic Platform. Filters are only available in the Omics Filtered View (Omics Summary is toggled off). Clicking the icon beside a filter will let you specify filtering parameters. Check the box next to the desired filters to apply them. Once you apply the filter, the table will update with the results and a chip will be placed above the table.
Omics Explorer Table
Data from the subject's ingested Omics tests are displayed in table form beneath the banner. In some views, you can further filter the data to fine tune your search.
Hyperlinks in the Omics Explorer Data Table link to the public annotation source.
Table Column Headers
-
In the Omics Filtered View (Omics Summary is toggled off), most of the table column headers correspond with the filters on the left side of the Omics Explorer. Filters will only apply to the sequence type and the variant type (for example, filtering on the Somatic Short Variants).
-
In the Omics Summary view (Omics Summary is toggled on), the first six table columns are the most likely to populate data (CKB-Variant Type). The other table columns are for short variants and will be blank if it doesn’t apply to that variant type.
List of Table Column Headers: Most data in the Omics Explorer table is curated by LifeOmic except where noted below.
-
CKB – LifeOmic’s own internal database built from external sources (public data)
-
Gene – this hyperlink opens the NCBI site for that specific gene in a new window
-
AA Change: Amino Acid change
-
NC Change: Nucleotide change
-
Position: This is the DNA position in the genome where the mutation happened. The hyperlink opens a genome browser in a new window, such as UCSC
-
Variant Class (refers to missense, 3'UTR, intronic, etc.): Variant Class and Coding Effect overlap with the addition that Variant Class lists intronic and other non-coding variant classes. To filter for this, use the Coding Effect filter (as shown below).
-
Variant Allele Freq: Frequency the variant was detected in this sample (such as variant reads/total reads)
-
Zygosity: Heterozygous (HET), Homozygous variant (HOM), or Homozygous reference (REF)
-
Genomes Freq: Population frequency from gnomAD whole genome sequencing data
-
Genomes HOM: Number of people homozygous for the variant in the gnomAD whole genome sequencing data
-
Exomes Freq: Population frequency from gnomAD whole exome sequencing data
-
Exomes HOM: Number of people homozygous for the variant in the gnomAD while exome sequencing data
-
DBSNP RS ID: ID for the variant in the dbSNP database
-
ClinVar Significance: Clinical Significance reported in ClinVar from submitting labs
-
ClinVar Disease: Disease for which clinical significance was assigned in ClinVar
-
COSMIC Status: Status reported in the Catalogue of Somatic Mutations in Cancer (COSMIC)
-
COSMIC Count: Number of samples in COSMIC with the variant
-
Damaging %: Percentage of in-silico predictors (18 max) that predict the variant is damaging (for example, 9/18 = 50%)
-
Damaging Rank Score: The mean rank of the all in-silico predictors with value between 0-1,1 being most likely damaging and 0 being most likely benign.
-
Sift: One of the 18 in-silico predictors used and its individual prediction. D = damaging, T = tolerated
-
MUT Taster: One of the 18 in-silico predictors used and its individual prediction. D = damaging, T = tolerated
-
FATHMM: One of the 18 in-silico predictors used and its individual prediction. D = damaging, T = tolerated
-
Gene ID
-
Transcript ID
-
Gene Class
-
Ref (provided by the sequencing result)
-
Alt (provided by the sequencing result)
-
Ref:Alt:Depth (provided by the sequencing result)
-
VCF Qual (provided by the sequencing result)
-
VCF Filter (provided by the sequencing result)
-
Coding Effect
-
EXON Number
-
Impact
-
Min Freq
-
Max Freq
-
ClinVar ID
-
ClinVar Review
-
ClinVar Submission
-
ClinVar Nearby
-
COSMIC ID
-
COSMIC Histology
-
COSMIC Site
-
COSMIC Nearby
-
IGV: Integrated Genome Viewer is a public tool. It’s useful for research and to validate if a mutation looks correct. Clicking the IGV icon in a row opens an IGV viewer. You can view BAM files (raw data) in the IGV.
Omics Data Viewing Options
Data from Omics tests can be viewed either in a summary or filtered view. Click the Explorer or Summary tab on the upper-right of the page.
Omics Summary
The Omics Summary view combines all the variants from a single test by sequence type and variant type into a single table for browsing.
Omics Filtered View
With the Explorer tab selected, the default Omics Filtered View is displayed. This view breaks down the Somatic and Germline data into separate tabs/data tables and filtering is enabled.
-
Variants Types - The number beside each of these represents the number of variants present in this sample.
-
Short (single changes in the DNA such as one base change or small insertions or deletions)
-
Structural (rearrangement of the DNA such as translocation and inversion)
-
Copy Number (duplications or deletions of a large region)
-
Expression (RNA sequencing)

This differs from the “Variant Count” found at the bottom left of the filters list. The variant count reports the number of variants matching the selected filters. (Filter options change based on which Variant Type is selected).

-
Gain/Loss-of-Function, Protein Effect, Gene Match, and Affects Alternate Transcripts
Gain/Loss-of-Function (red square) - Gain of Function and Loss of Function are specific protein effect annotations in the JAX Cancer Knowledgebase that indicate a variant has been found to change the function of the protein in a positive (gain) or negative (loss) manner. Gain of Function indicates the variant changes the protein to increase its activity or bypass normal regulation of its function. Loss of Function indicates a variant damages the protein causing it to no longer function as normal. Gain of Function variants typically occur in oncogenes that drive tumor growth, and Loss of Function variants typically occur in tumor suppressor genes that normally inhibit tumor growth.
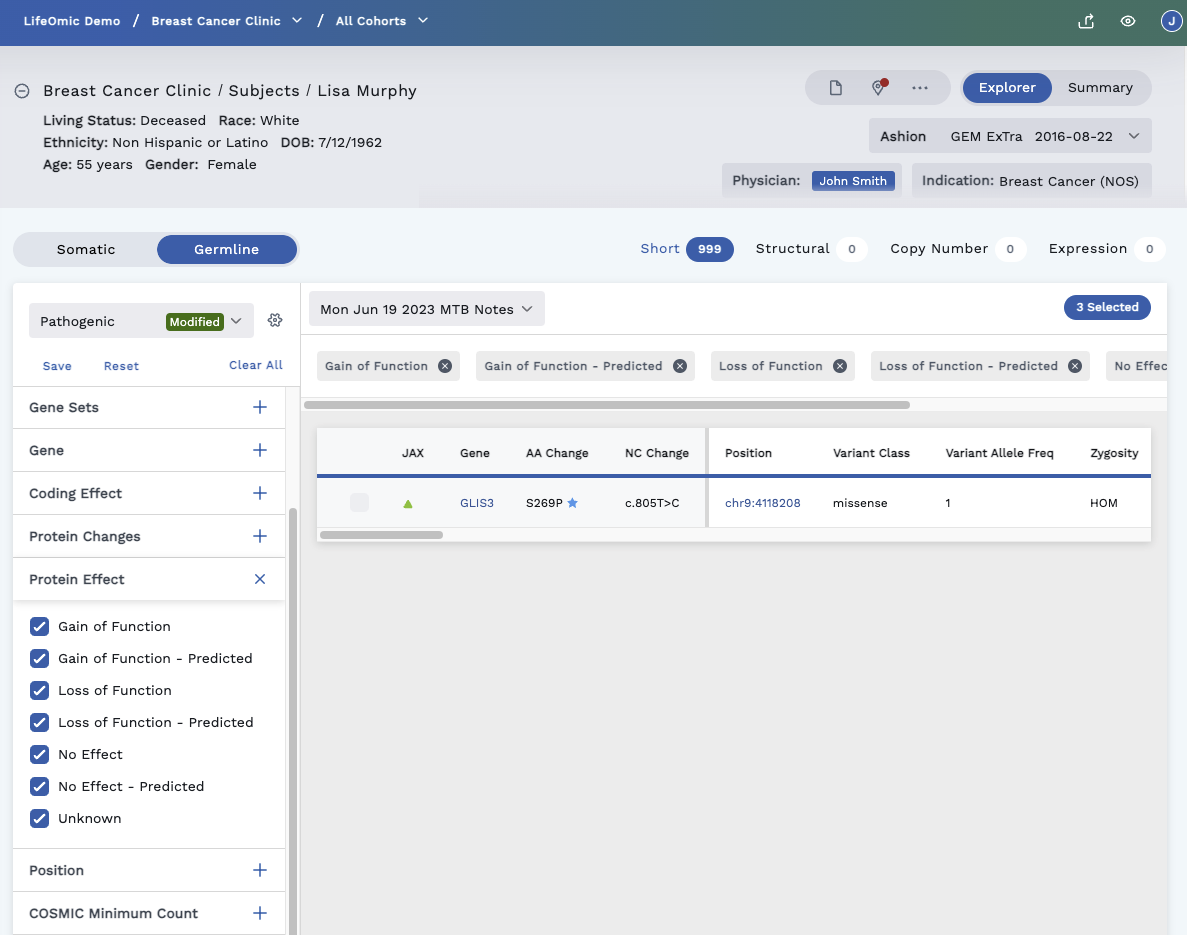
Protein Effect (green triangle) – The Protein Effect marker indicates that a variant is annotated in the JAX Cancer Knowledgebase. Protein Effect annotations may include ‘Unknown’, ‘No Effect - Predicted’, ‘No Effect’, ‘Loss of Function - Predicted’, ‘Loss of Function’, ‘Gain of Function - Predicted’ or ‘Gain of Function’. The specific effect is listed in the Protein Effect column in the variant table. Filters for Protein Effect are also available in the JAX Cancer Knowledgebase and Protein Effect filter in the left filters for short variants.
Gene Match (purple dot) – Refers to the cancer knowledge base (CKB). The Gene Match means this gene is known to have a gene drug association which can be viewed on the Variant Detail page.
Affects Alternate Transcript (blue star) – A blue colored star on the table means there may be other information or different transcripts (RNAs) for this gene, even though only the canonical transcript is displayed in the Omics Explorer Table to keep the table simple. To view the other transcripts/information, click on the row to open the Variant Detail page. Here you can scroll down to view the Alternate Transcripts.
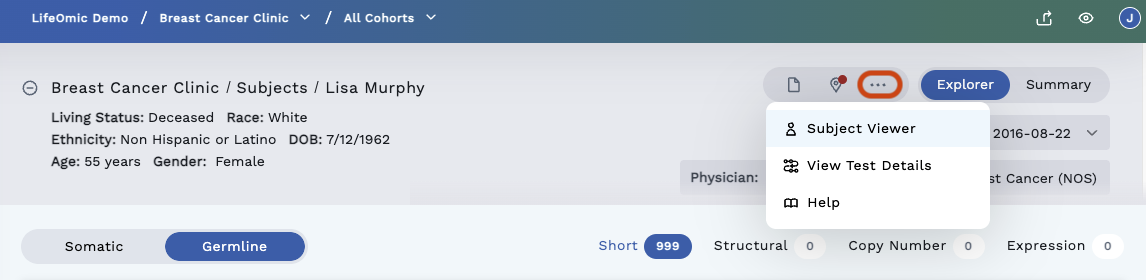
Access to More Data
In the top right corner of the header are options to access more information regarding the subject and their test data. Click the three dots to reveal all options.
-
View PDF - Generates PDF from information.
-
Biomarkers - Displays related biomarkers.
-
Help - Opens the Omics section of the user guide in a new browser window.
-
View Test Details - The View Test Detail Button opens the Omics Tests LifeOmic Platform page in a new browser window. This page contains details of the test.
-
Subject Viewer - Allows you to switch to the Subject Viewer page.