Programs Analytics
You can view your program analytics to see how subjects have been engaging with your programs.
-
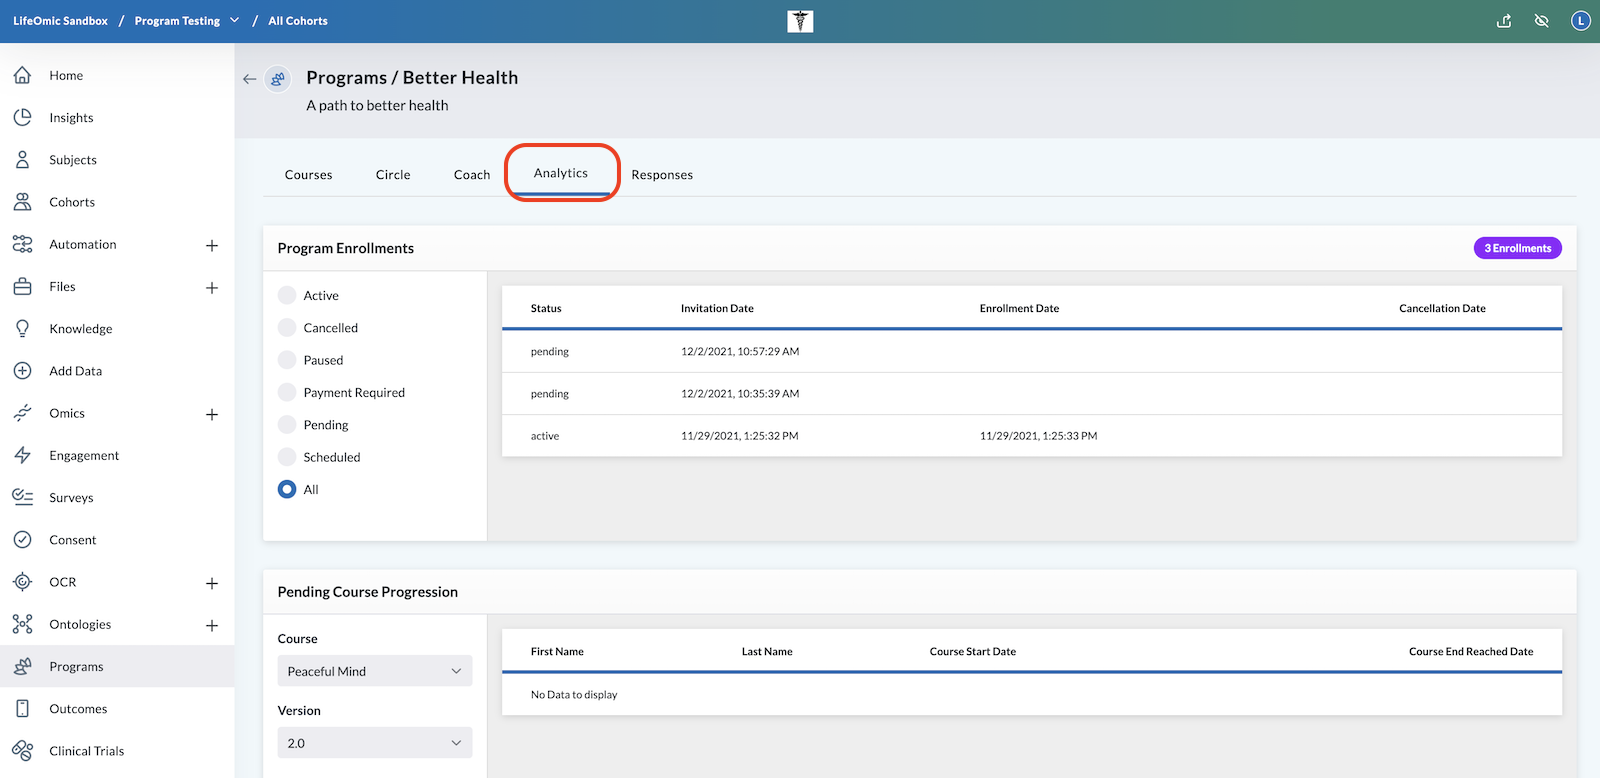
Click on Programs on the left menu.
-
Select the Program you wish to analyze.
-
Click on the Analytics tab.
-
Scroll through the available tables to view engagement data on your programs:
Program Enrollments
Program Enrollment data displays the status, invitation date, enrollment date, and cancellation date.
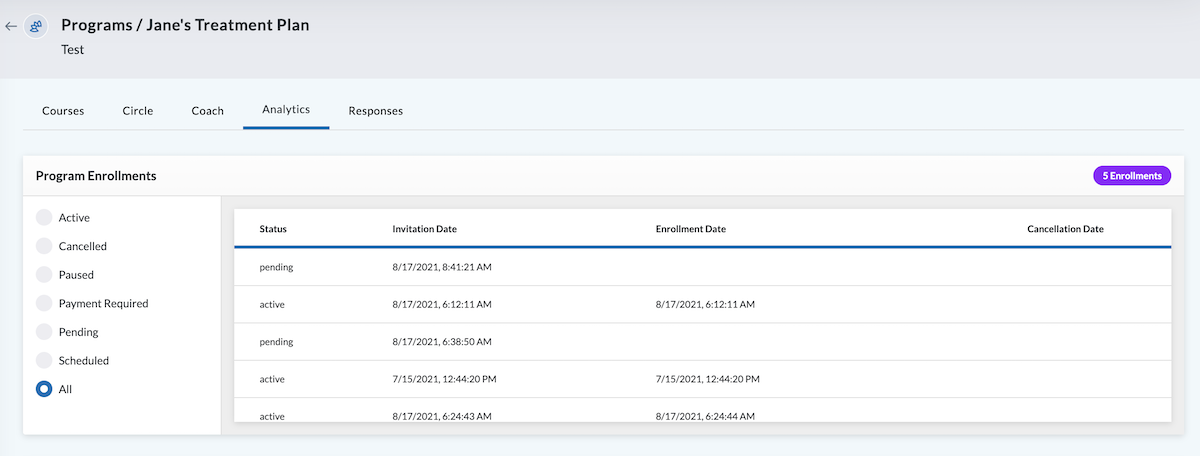
Data displayed can be filtered by selecting the buttons on the left side of the table. Options include:
- Active
- Cancelled
- Paused programs
- Payment Required
- Pending
- Scheduled
- All
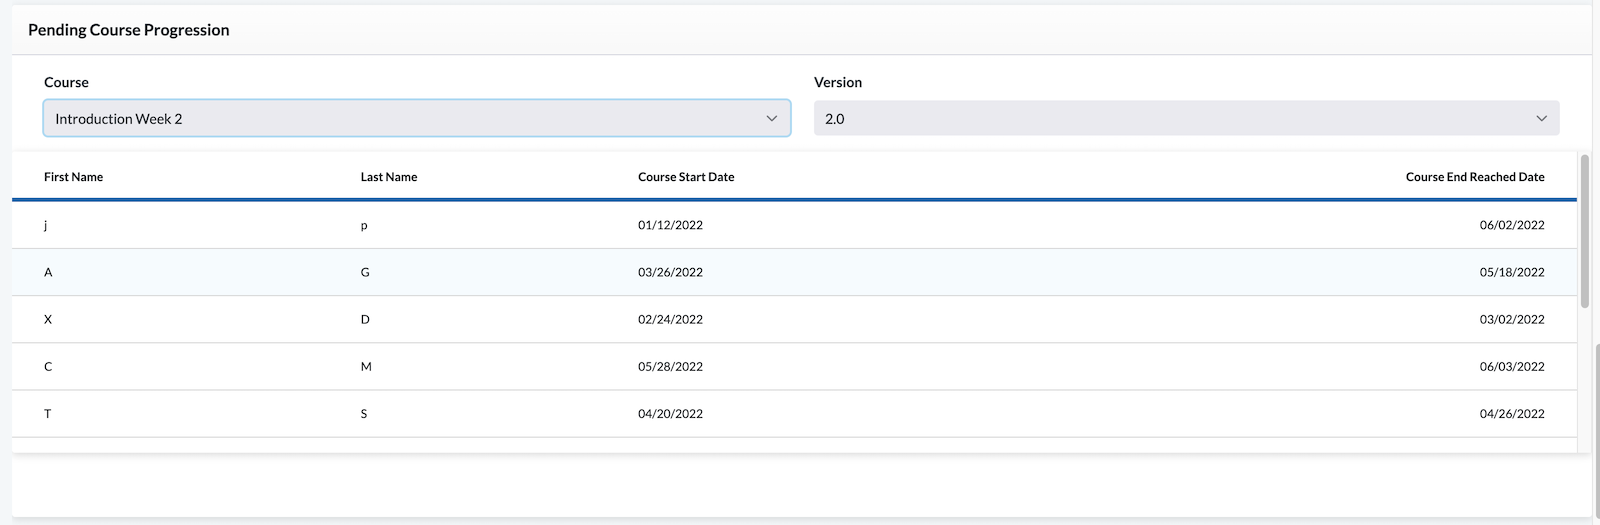
Pending Course Progression
This graph displays where users have stopped within the program. Users listed in this table have made it to the end of the course but have NOT completed all the activities (activities must be skipped or completed to move on).
View the Pending Course Progression by:
- Select your Course from the dropdown menu
- Select the version of your Course
The table displays the subject's name, course start date, and course completion date.
Program Enrollment Detailed View
To see more Subject Data, click on the row of interest within the table. The following information opens in a new dialog box:
- SubjectID
- First Name
- Last Name
- Date of Birth (DOB)
- Gender
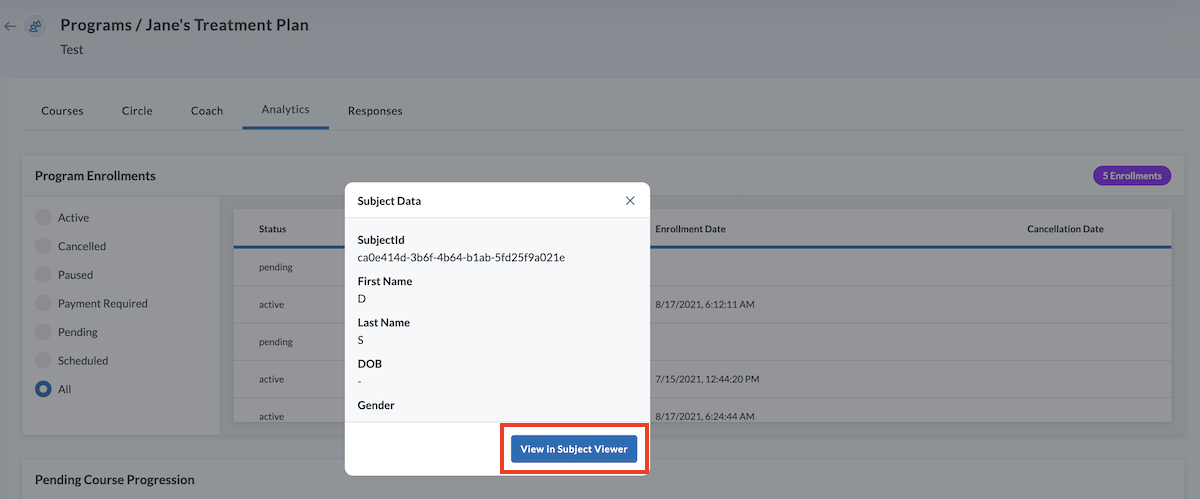
Data can be masked (hiding their DOB and only listing their initials) or unmasked . To switch between masked mode or unmasked mode, close the Subject Data dialog window by clicking the "X", then click the eye icon in the top right of your screen. Now, once again, click on the row of interest to display the subject data details.
To view more data on that subject, click View in Subject Viewer (opens in a new tab).
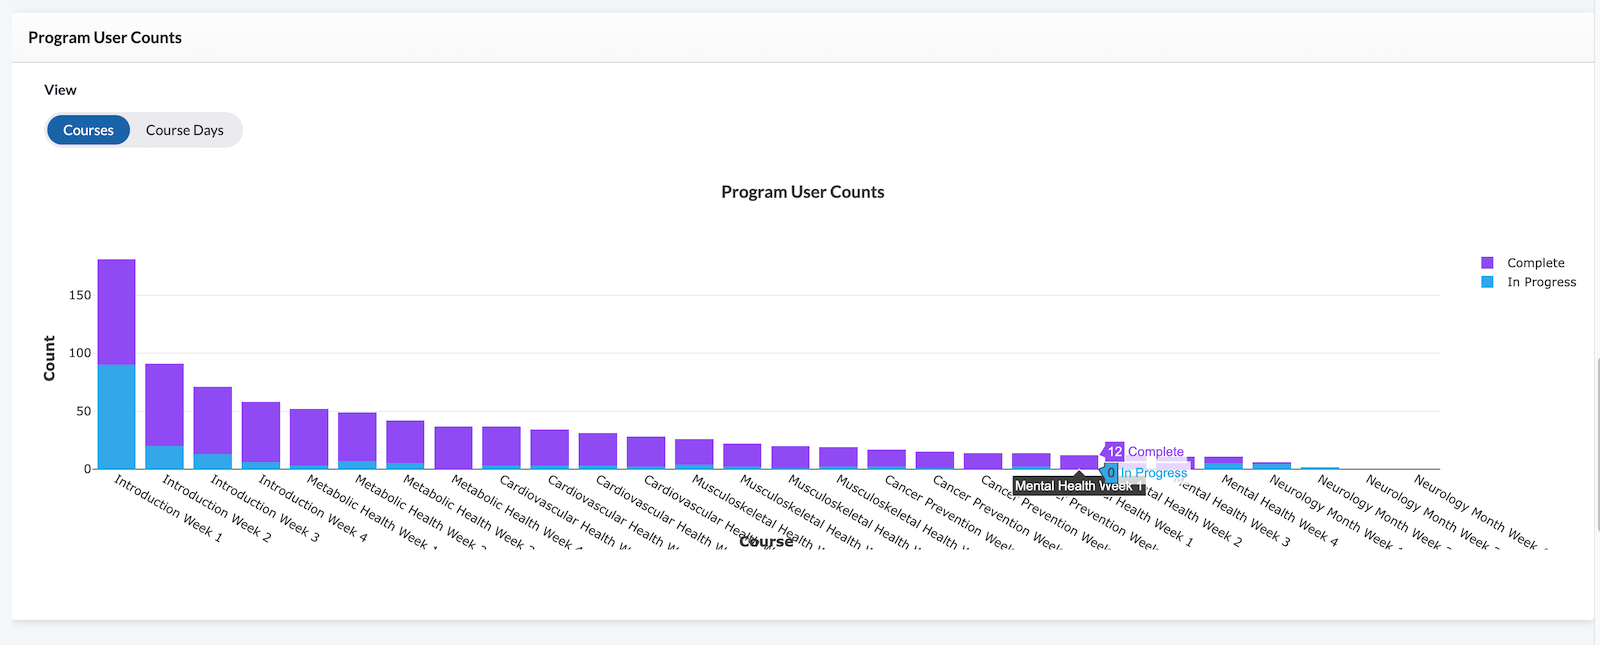
Program User Counts
Program User Counts allow you to toggle between two views (located at the top left of the table): Courses (completed VS in progress) and Course Days (shows how many subjects are on each day of the course progression).
-
Courses: This graph shows the count of subjects in each of your programs who:
- Have completed (purple graph)
- Are In Progress (blue graph) - meaning subjects are progressing through the course or are stuck in the course because they have past due activities to complete, have paused the course, or have been paused because their payment information needs to be updated.
-
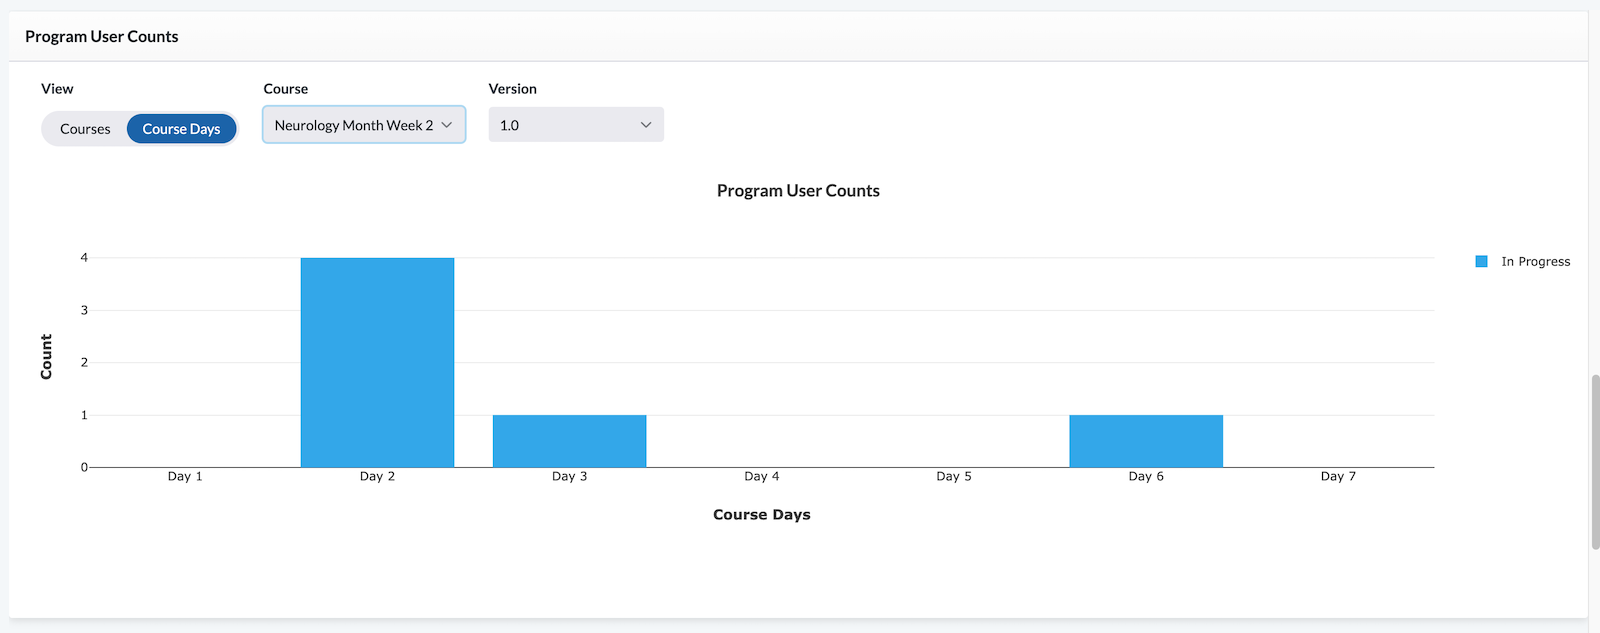
Course Days: After selecting Course Days, choose the course you wish to view from the dropdown as well as the version. This graph displays the number of subjects on each day of the course.
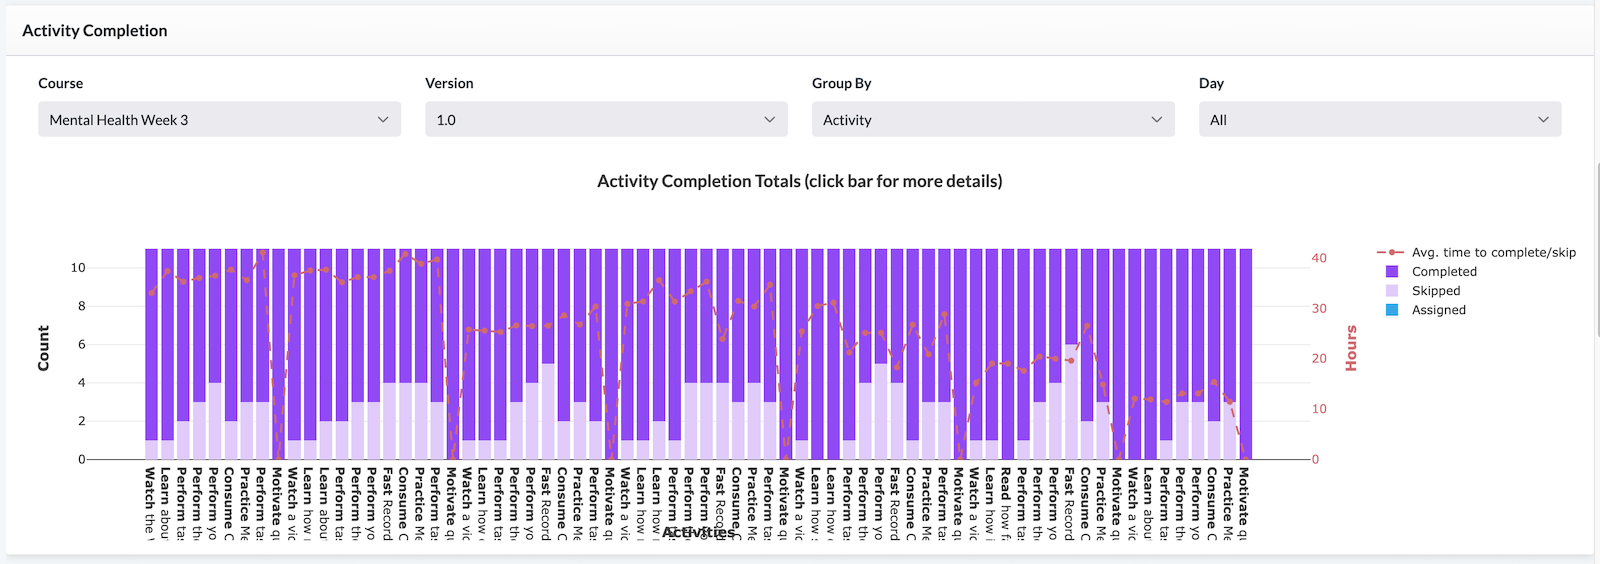
Activity Completion
Activity Completion shows the number of subjects who have completed, skipped, or have been assigned an activity. It also displays the average time to complete or skip the activity. These results can be filtered using the dropdown menu to display the data by activity, day, or activity verb.
To filter the data displayed in the Activity Completion section:
-
Select your Course from the dropdown menu.
-
Select your version of the Course.
-
Select how you wish to Group the data. Options include:
- Activity
- Day
- Activity Verb
noteEach activity has an activity verb (such as Perform or Read). Filtering by Activity graphs each individual activity in your course as a separate bar on the chart. Filtering by Activity Verb graphs the broader categories of the verbs. Filtering by the verb helps you see if subjects are skipping a specific verb such as Read.
-
Select Day to display from the dropdown (choose all or a specific day within the program).
Hovering your cursor over the graph presents the exact subject count for that graph.
Zoom into a portion of the chart by clicking and dragging on a portion of the chart. To return to the zoomed out view, click on the blank space to the right of the furthest right graph bar.
Activity Completion Chart Key
The chart key is located to the right of the chart. Click on any of the chart categories within the key to enable or disable their display in the chart.
Graph categories include:
- Avg time to complete/skip (red line graph)
- Completed (dark purple)
- Skipped (pale purple)
- Assigned (blue)
While all subjects in an activity bar graph have been assigned the activity, the Assigned bar (pale purple) represents only those subjects that remain at the Assigned status of the activity (not having begun, completed, or skipped it). For example, if twelve subjects are assigned an activity (pale purple), and three have completed it (dark purple), four have skipped it (blue), the graph for Assigned only shows five subjects (pale purple) - not all twelve initially assigned it.
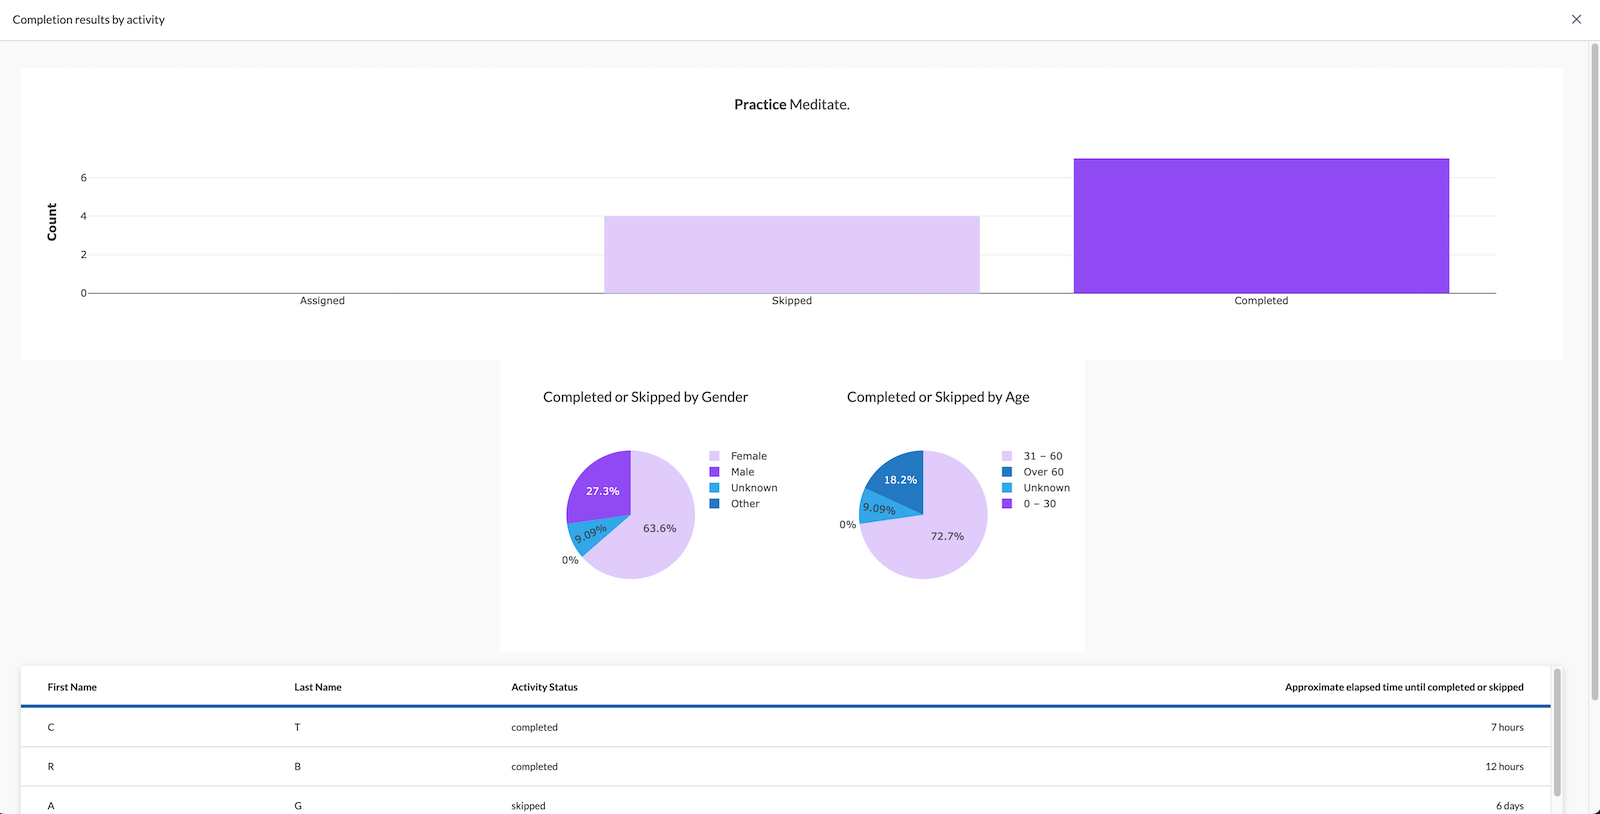
Activity Completion Detailed View
You can drilldown and see more details for a single activity. This drilldown is only available when you select "Activity" from the Group By dropdown. Once the chart displays, click on the bar of the activity you wish to see in more detail.
In the Meditation example displayed, you see two graphs and a table. The bar graph shows the number of subjects with the status of either assigned, skipped, or completed for that activity. The pie graph breaks this down further by letting you see the gender and ages of subjects who have skipped the activity. The table displays the subject's name, activity status, and time to skip or complete it.